Setting Up Communication between the PMC and PeerIQ
Before you can collect data in PeerIQ, you must set up communication between the PMC and PeerIQ. This involves two key steps:
-
Configuring PeerIQ's connection to a broker: Set up PeerIQ's connection to a Peer Management broker. The broker manages communication between the PMC and other PeerGFS components, such as Peer Agents, and facilitates communication between PMC and external applications, including PeerIQ.
-
Enabling data transfer: After configuring the connection to the broker, enable the transfer of data from the PMC to PeerIQ.
For detailed instructions, see these sections:
Configuring PeerIQ's Connection to a Peer Management Broker
Depending on your current PeerGFS implementation, there are several methods for connecting PeerIQ to a Peer Management broker. This section first outlines common deployment scenarios and specifies which IP address or hostname should be used for the connection. It then provides step-by-step instructions for establishing the connection.
Typical Broker Deployments
Basic Configuration
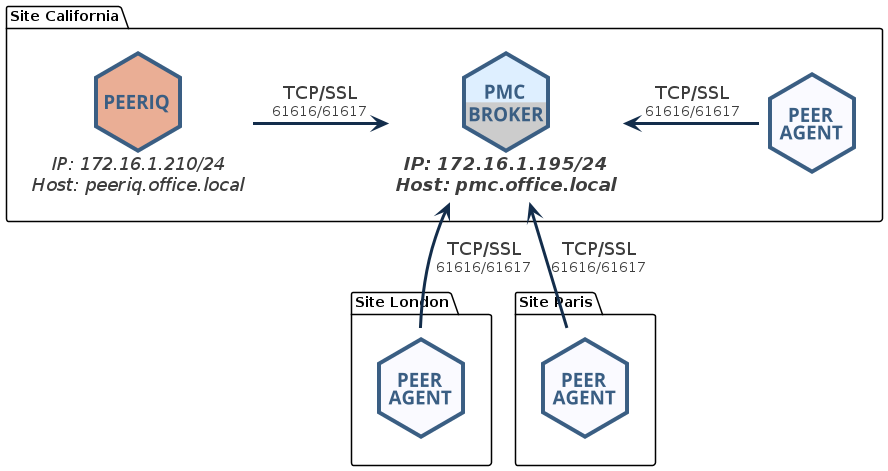
For a standard PeerGFS deployment, the most common configuration involves a single broker deployed on the PMC host. In this scenario, PeerIQ must be deployed on the same local network as the PMC host. To establish the connection, you can use either the IP address of the PMC host (e.g., 172.16.1.195) or its fully qualified domain name (FQDN) (e.g., pmc.office.local).
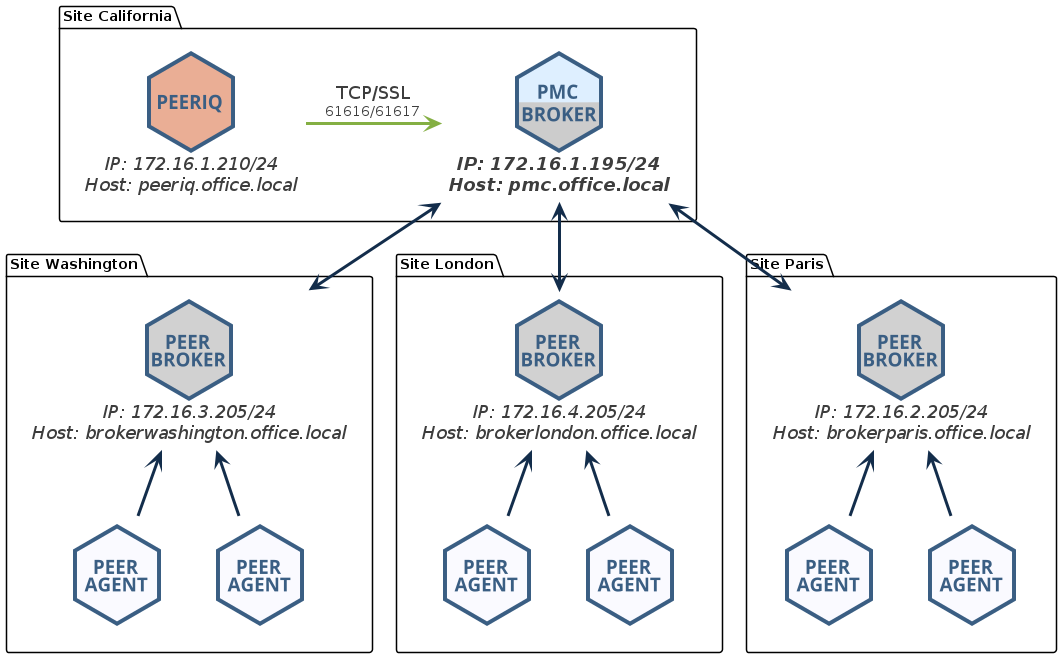
Network of Brokers
If you have deployed a network of brokers, it is crucial to connect to the IP address of the PMC running the broker if they are on the same host, or to the broker with which the PMC has a direct network connection. In the following example, you could use either the IP address 172.16.1.195 or the FQDN pmc.office.local:
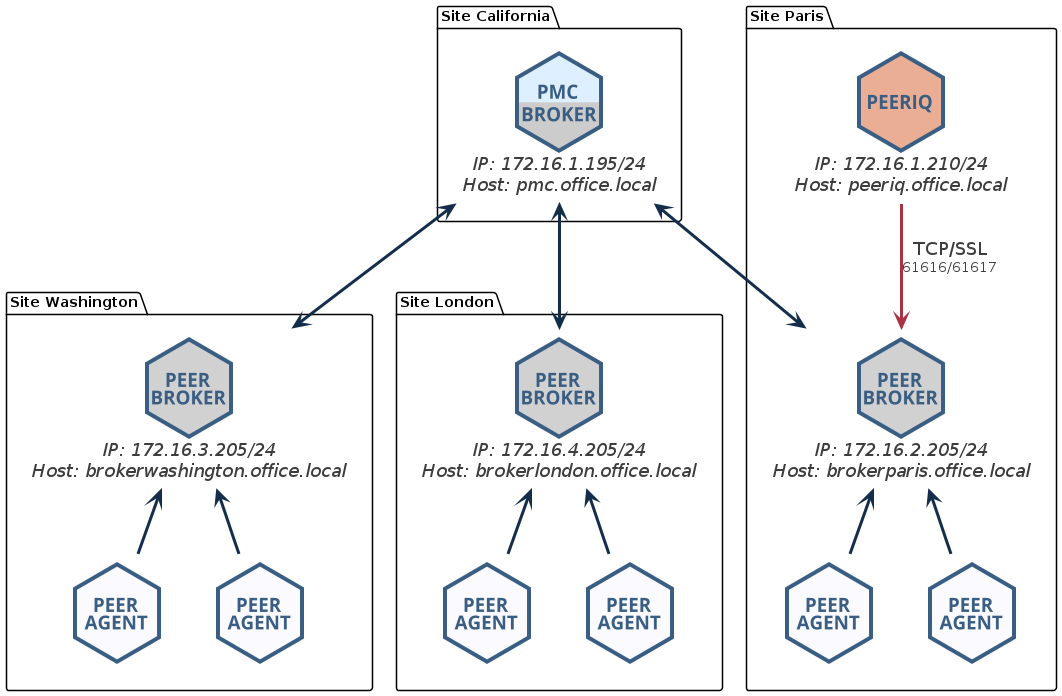
Attempting to connect to another broker within the network that does not have a direct link to the PMC will be unsuccessful and result in PeerIQ not receiving any data. In the following example, the user is trying to connect to the broker at the Paris site, which lacks a direct link to the PMC. Consequently, no data will be transmitted.
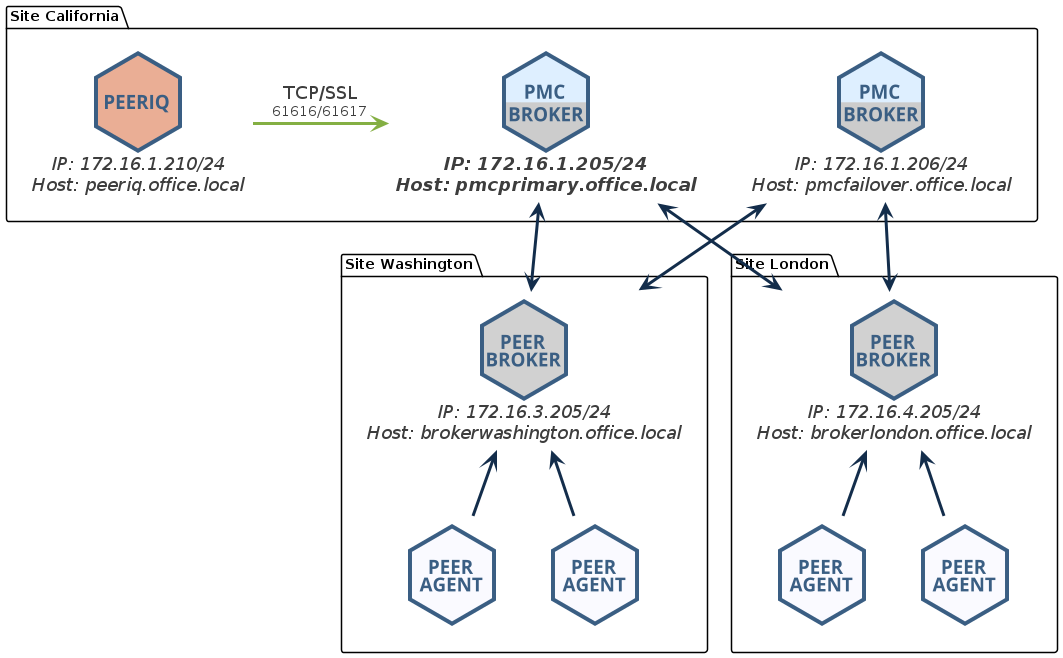
Redundant PMC
In a redundant PMC configuration, only the primary PMC can be monitored. In the following example, you would connect PeerIQ to the IP address 172.16.1.205 or to the FQDN pmcprimary.office.local.
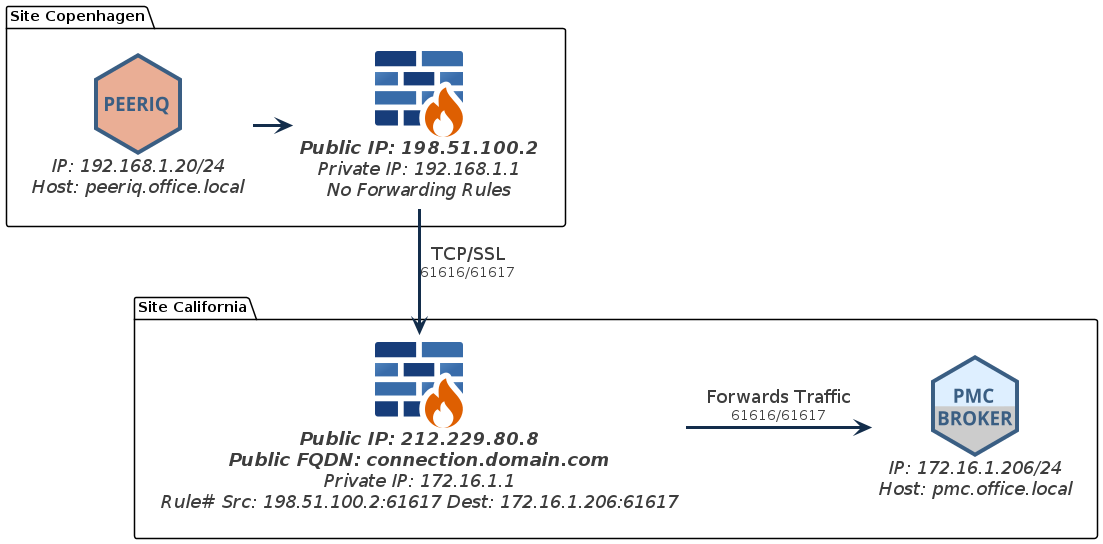
NAT Firewall
When connecting PeerIQ to the broker through a NAT firewall, it is essential to configure source and destination rules to forward traffic to the PMC. In the following example, the firewall at the California site is configured to forward all traffic received from IP 198.51.100.2 on port 61617 to the IP address of the broker. In this example, you would connect to the IP address 172.16.1.205 or to the FQDN connection.domain.local.
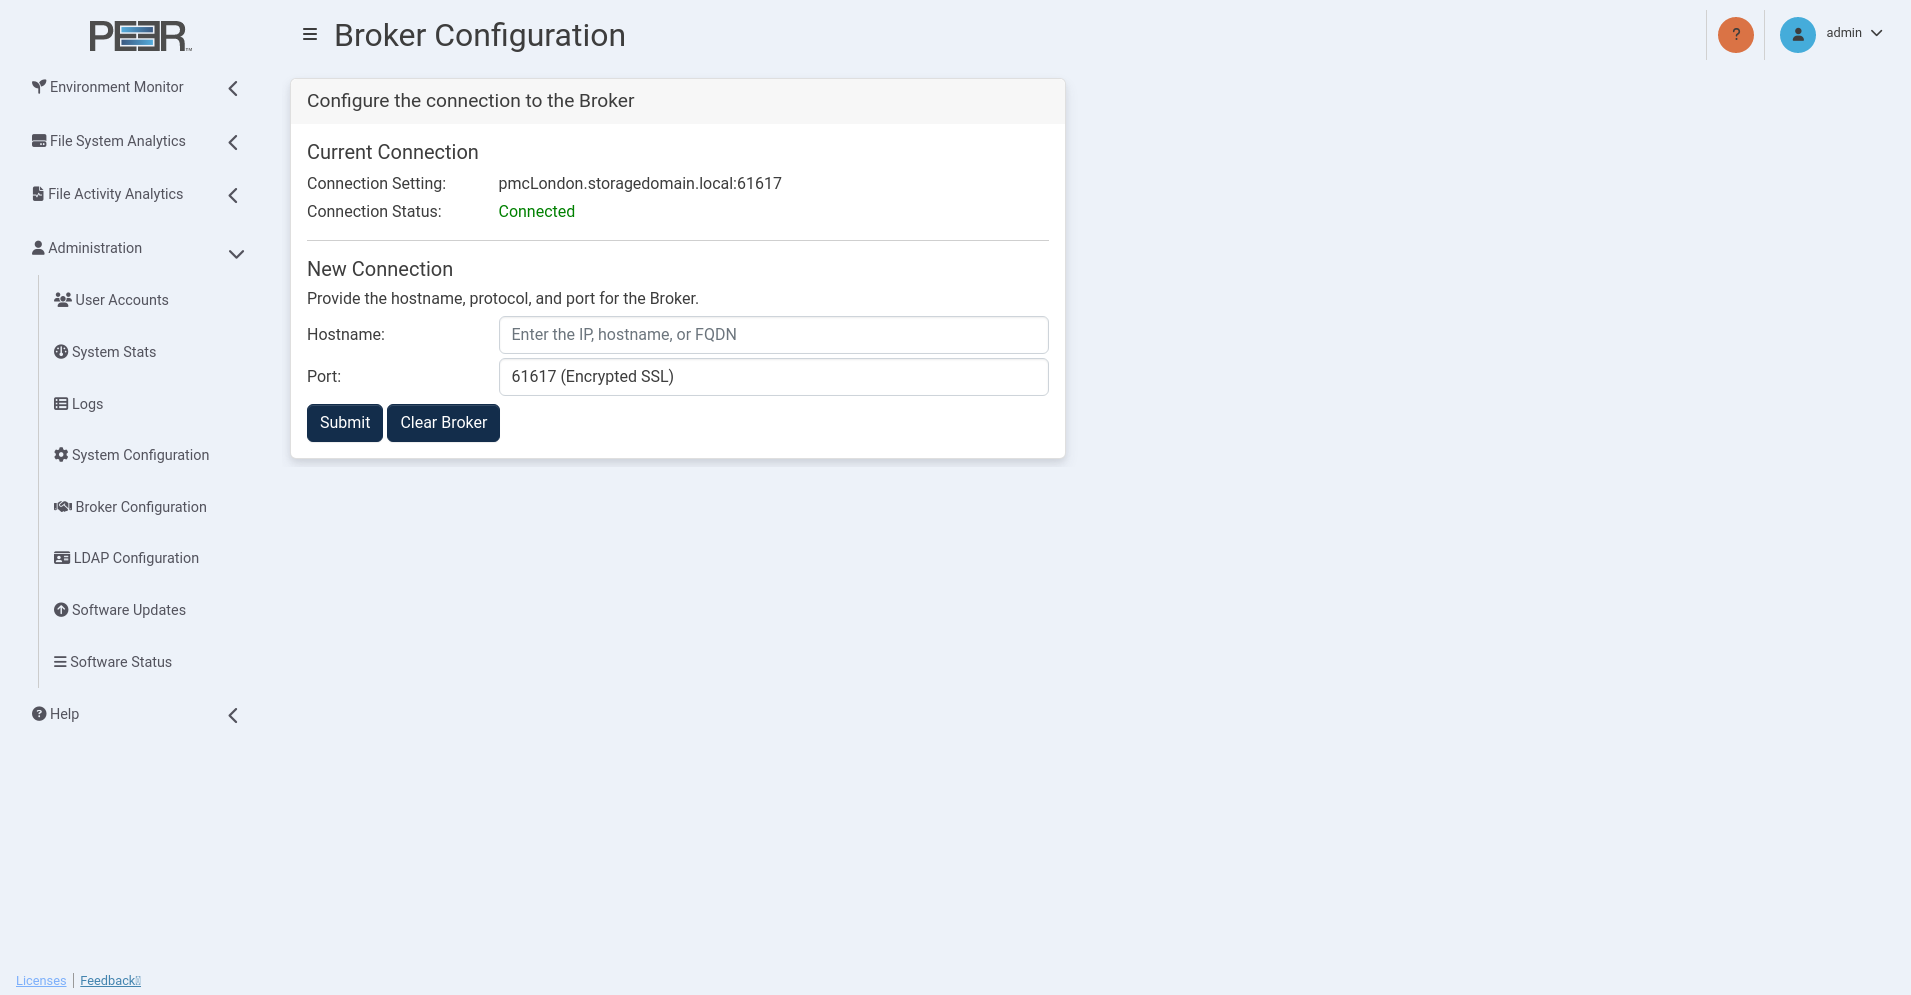
Configuring the Broker Connection
To configure PeerIQ's connection to a broker:
-
Using your Administrator account, open PeerIQ.
-
Select Broker Configuration from the menu on the left.
The Broker Configuration page is displayed, showing No Connection as the connection status.
-
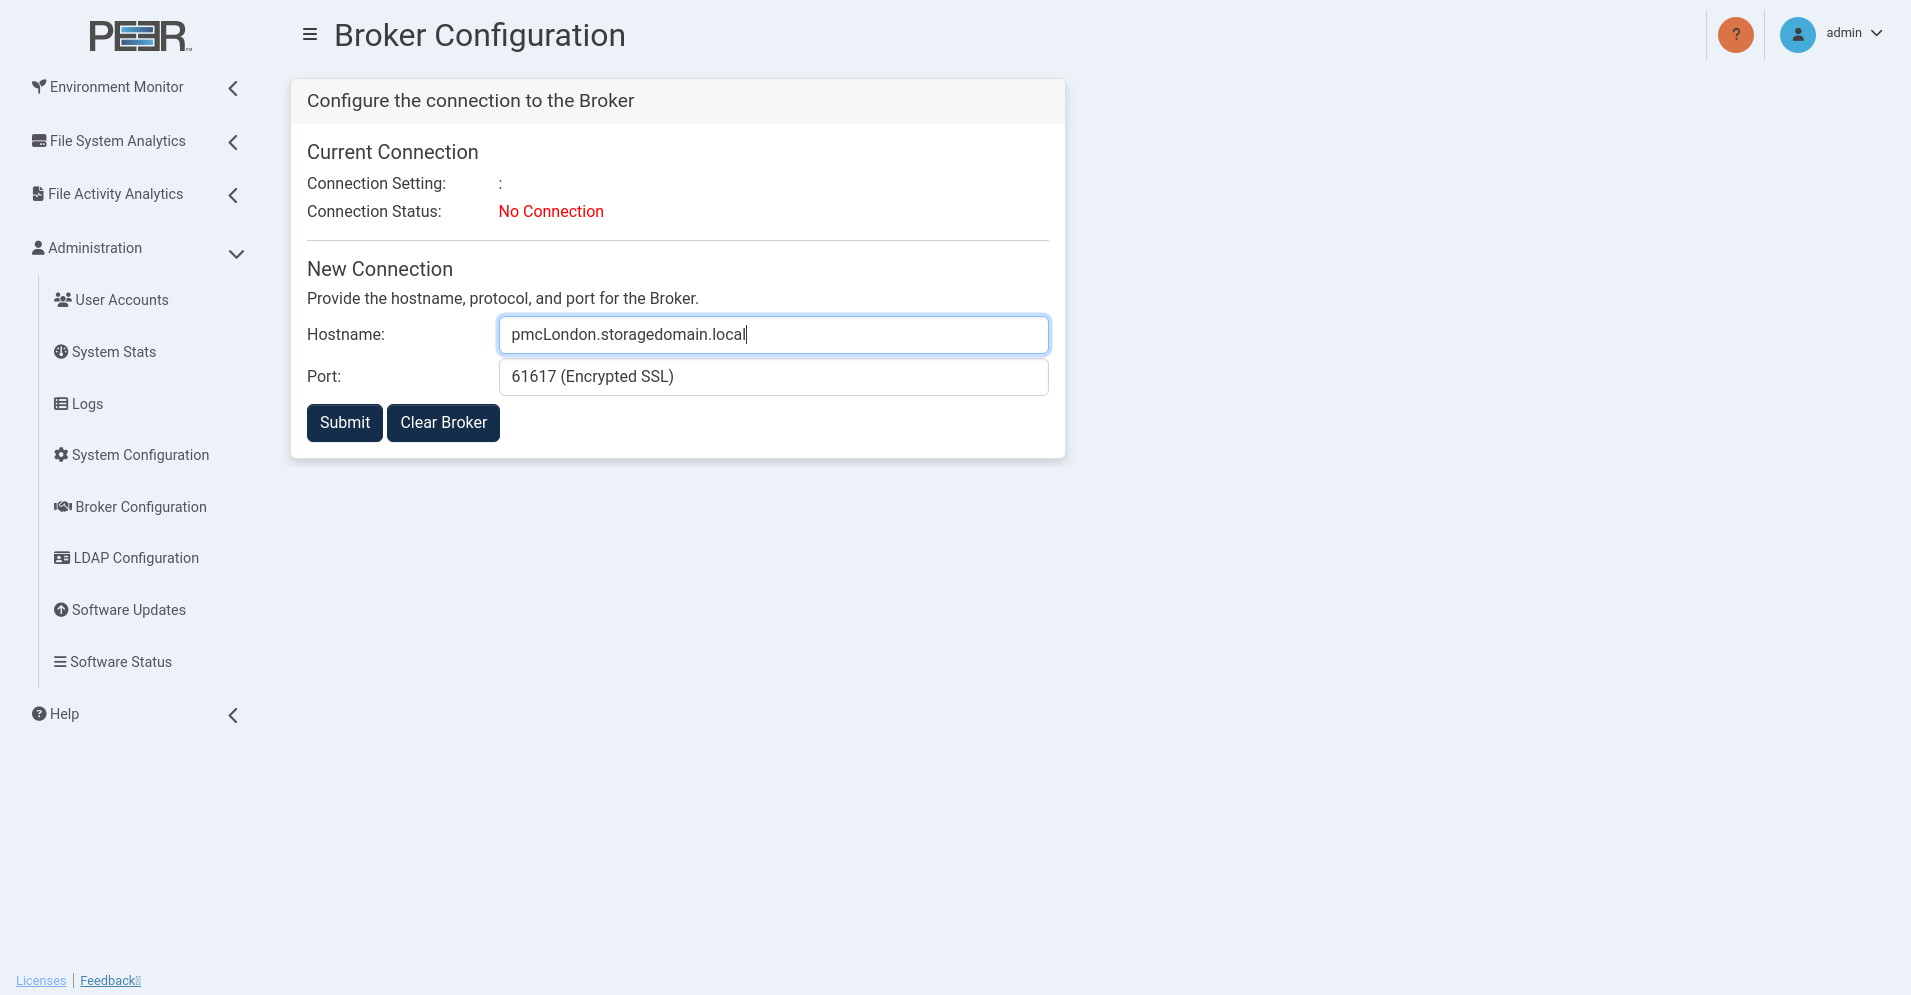
In the Hostname field, enter the IP address or the FQDN of the broker.
-
Choose between an encrypted SSL 61617 connection or a standard TCP connection on 61616.
-
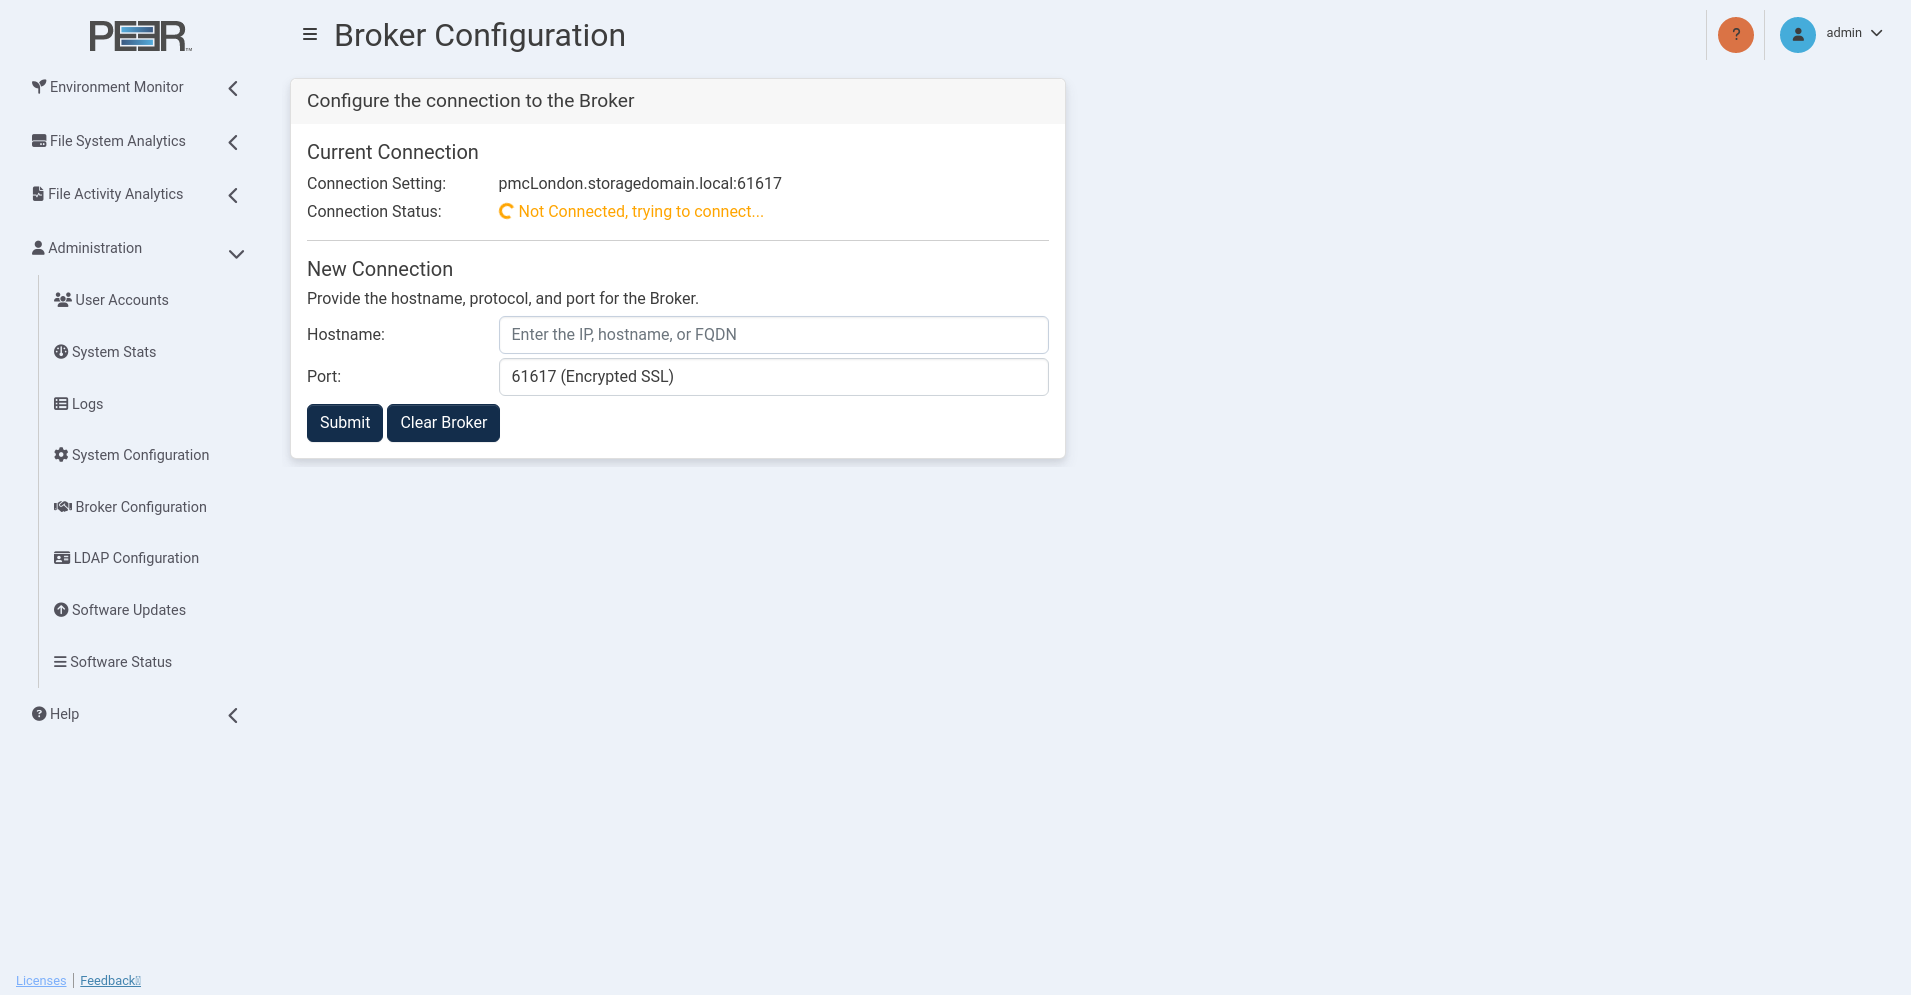
Click the Submit button.
The connection status changes to Not Connected, trying to connect... This status will persist until the connection is established, which can take up to a minute.
Once connected, the status changes to Connected.
If the status does not change to Connected, refer to the Connection Issues section.
Stopping Attempts to Connect to a Broker
To stop connection attempts from PeerIQ to a broker, click the Clear Broker button.
Connection Issues
When attempting to connect PeerIQ to a broker, you may encounter these issues:
-
Incorrect IP address or FQDN: Ensure you have entered the correct IP address or fully qualified domain name (FQDN) for the broker you are trying to connect to.
-
Firewall restrictions: Verify that there are no firewall restrictions blocking the connection on ports 61617 (SSL) or 61616 (TCP).
-
Network connectivity problems: Check for network issues, such as unstable connections or packet loss.
-
Broker service not running: Verify that Peer Broker Service is running on the PMC system and that there are no errors in the log files.
Enabling Peer Management Center to Send Data to PeerIQ
Use the Create Analytics Job wizard to create an Analytics job that collects Analytics data for the selected storage platform.
Before You Begin
Before creating an Analytics job:
- Verify that the Peer Agent is installed and connected.
- Verify that Peer Agent can access the desired storage platform.
- Verify that any required storage platform credentials are available.
Overview
The Create Job Wizard guides you through configuring an Analytics job:
- Step 1. Job Type and Name
- Step 2. Management Agent
- Step 3. Storage Platform
- Step 4. Storage Information
- Step 5. Volumes and Paths
- Step 6. Analytics Options
- Step 7. Email Alerts
- Step 8. SNMP Notifications
- Step 9. Confirmation
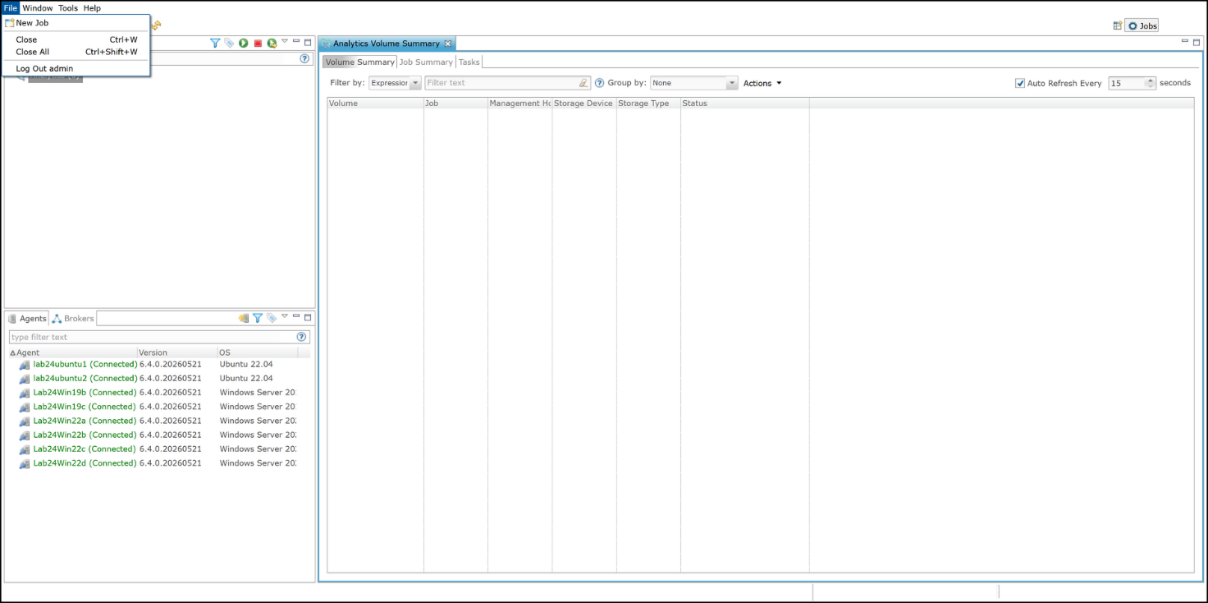
Step 1. Job Type and Name
To begin creating an Analytics job:
- Open Peer Management Center.
-
From the File menu, select New Job.
-
In the Job Name field, enter a name for the job.
The job name must be unique.
-
Click OK to proceed to the Management Agent page.
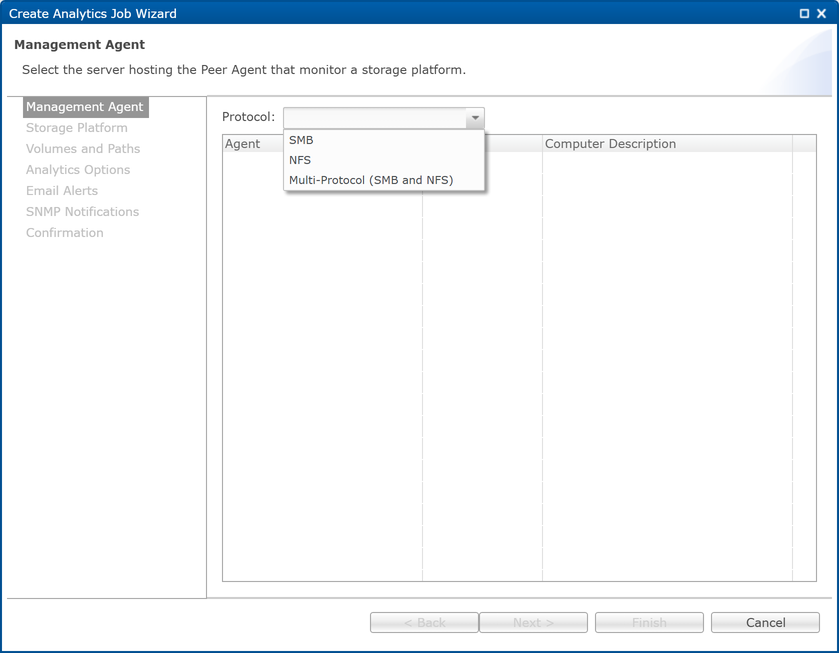
Step 2. Management Agent
Use the Management Agent page to select:
- The file-sharing protocol for the Analytics job
- The Management Agent for the Analytics job.
The file-sharing protocol determines how the Analytics job accesses the storage platform and monitors file activity. Available protocol options depend on your environment, Agent configuration, and licensing.
A Management Agent is a Peer Agent that provides access to selected storage platform and monitors the selected volumes for Analytics activity.
Multi-Protocol support allows the Analytics job to detect activity from both SMB and NFS clients for the same data set. Multi-Protocol configurations require an NFS export to reference the same directory and require Multi-Protocol license support.
| Agent Type | Multi-Protocol License Support | Available Protocol(s) |
|---|---|---|
| Windows-based Agent | N/A | SMB |
| Linux-based Agent | No | NFS |
| Linux-based Agent | Yes | NFS or Multi-Protocol |
To select the protocol and Management Agent:
-
Select the file-sharing protocol to use for this job: SMB, NFS, or Multi-Protocol.
The selected protocol determines the available storage platform and Agent options. After the job is created, jobs configured to use SMB cannot be modified to use NFS or Multi-Protocol. Likewise, jobs configured to use NFS and Multi-Protocol jobs cannot be modified to use SMB. You can switch between NFS and Multi-Protocol only if Multi-Protocol is supported in your environment and licensing
-
From the Agents table, select the Management Agent that will monitor real-time activity and scan the selected storage platform.
- Click Next to proceed to the Storage Platform page.
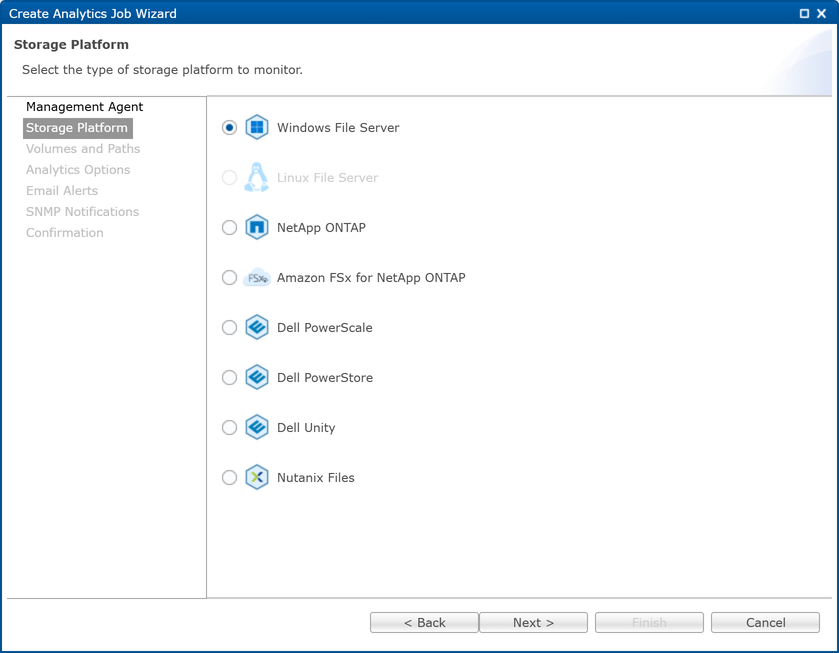
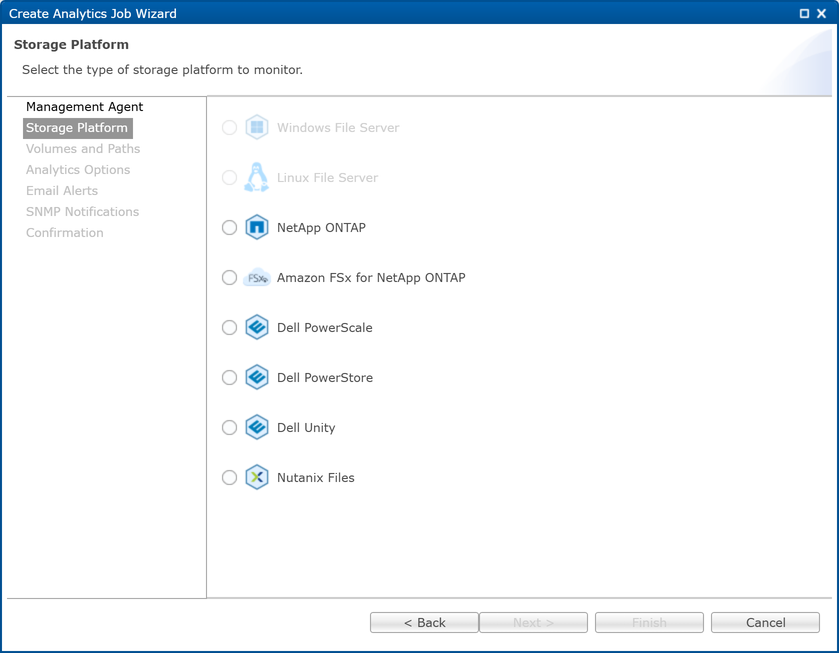
Step 3. Storage Platform
Use the Storage Platform page to select the storage platform to monitor. The types available depend on the file sharing protocol selected in the previous step:
- Windows File Server
- Linux File Server
- NetApp ONTAP
- Amazon FSx for NetApp ONTAP
- Dell PowerScale
- Dell PowerStore
- Dell Unity
- Nutanix Files
To select a storage platform:
- Select the storage platform that contains the volumes or file systems you want the Analytics job to analyze.
-
If you selected SMB, these are the available storage platform types:
-
If you selected NFS, these are the available storage platform types:

-
If you selected Multi-Protocol (SMB and NFS), these are the available storage platform types:
- Click Next to continue.
Step 4. Storage Information
Use the Storage Information page to configure credentials and access settings for the selected storage platform.
The Storage Information page is displayed for storage platforms that require storage connection information. If you selected Windows File Server or Linux File Server, the wizard skips this page and proceeds directly to the Volumes and Paths page.
To configure storage information using new credentials:
-
Select New Credentials.
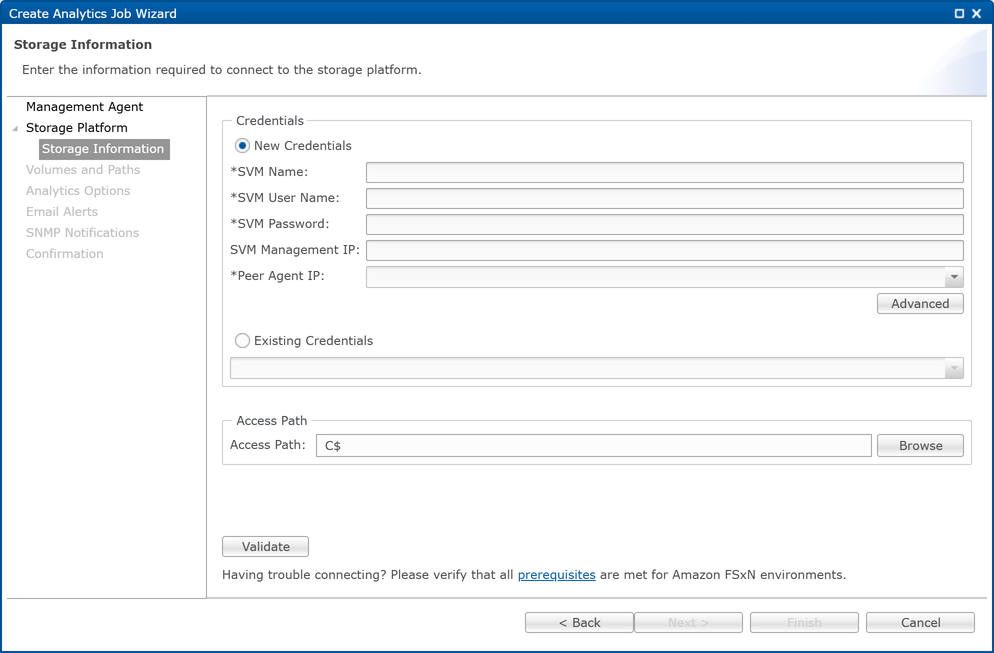
-
Enter the required credential information for the selected storage platform.
For platform-specific field descriptions, see Storage Platforms in the PeerGFS User Guide.
-
In the Access Path field, specify the access path or click Browse.
The access path specifies the network share or directory used by the Management Agent to access data stored on the selected volumes. The default access path is typically an administrative share, such as \\NASServer\C\$. If you specify a custom access path, ensure that it provides access to all selected volumes.
-
Click Validate to test the connection.
If validation is successful, a confirmation message is displayed.
-
Click Next to proceed to the Volumes and Paths page.
To configure storage information using existing credentials:
- Select Existing Credentials.
- Select the credential set from the drop-down list.
-
In the Access Path field, specify the access path or click Browse.
The access path specifies the path used to access the storage platform.
-
Click Validate to test the connection.
If validation is successful, a confirmation message is displayed.
-
Click Next to proceed to the Volumes and Paths page.
Step 5. Volumes
Use the Volumes page to select one or more volumes to monitor.
-
Select the volumes to monitor.
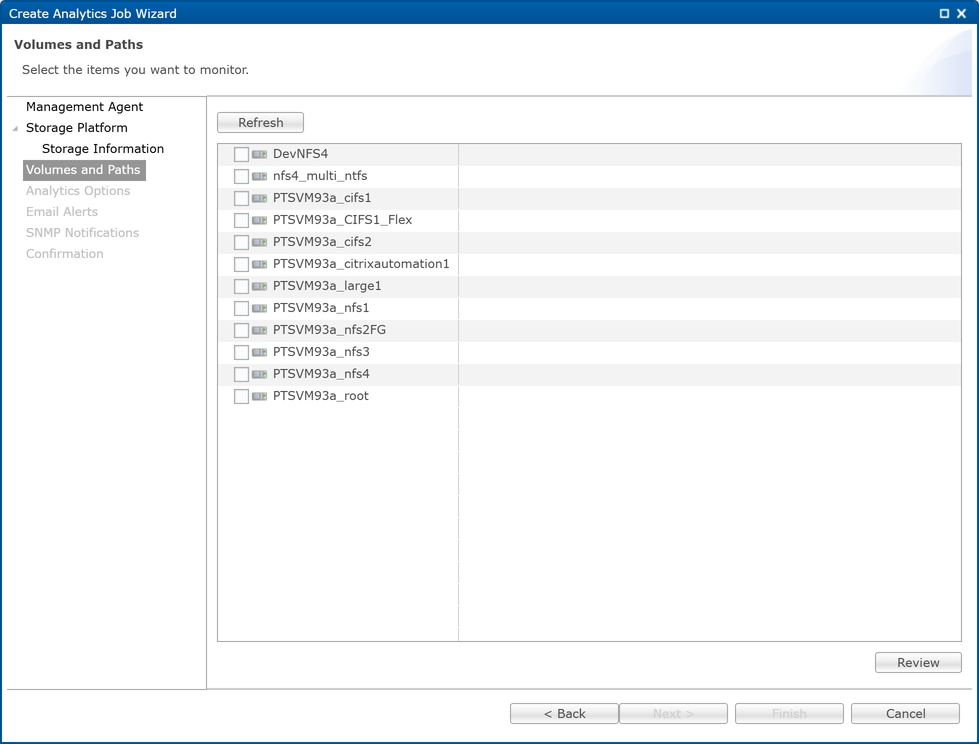
-
(Optional) Click Refresh if you have added, removed, or modified volume during the configuration of this job.
- (Optional) Click Review to review the selected items.
- Click Next to proceed to the Analytics Options page.
Step 6. Analytics Options
Use the Analytics Options page to configure the Analytics data collected by the job.
The Analytics job can collect the following types of Analytics data:
-
File System Analytics (FSA)
Collects file system Analytics data by performing scheduled scans of the selected location. The collected data provides a point-in-time view of file system state for analysis and reporting.
-
File Activity Analytics (FAA)
Collects file activity data from the selected location. The collected data includes summary-level activity statistics and can also include detailed real-time file activity events.
-
Malicious Event Detection (MED)
Collects alert data for suspicious or potentially malicious file activity detected in the selected storage location.
To configure Analytics options:
-
Select the Analytics options to enable:
File System Analytics
- To enable scheduled file system scans, select Collect File System Analytics.
File Activity Analytics
-
To enable file activity data collection, select Collect File Activity Analytics.
-
To collect detailed real-time file activity events in addition to summary-level activity statistics, select Collect detailed real-time activity.
Malicious Event Detection
- To enable MED alert collection, select Enable Malicious Event Detection (MED) and collect the alerts.
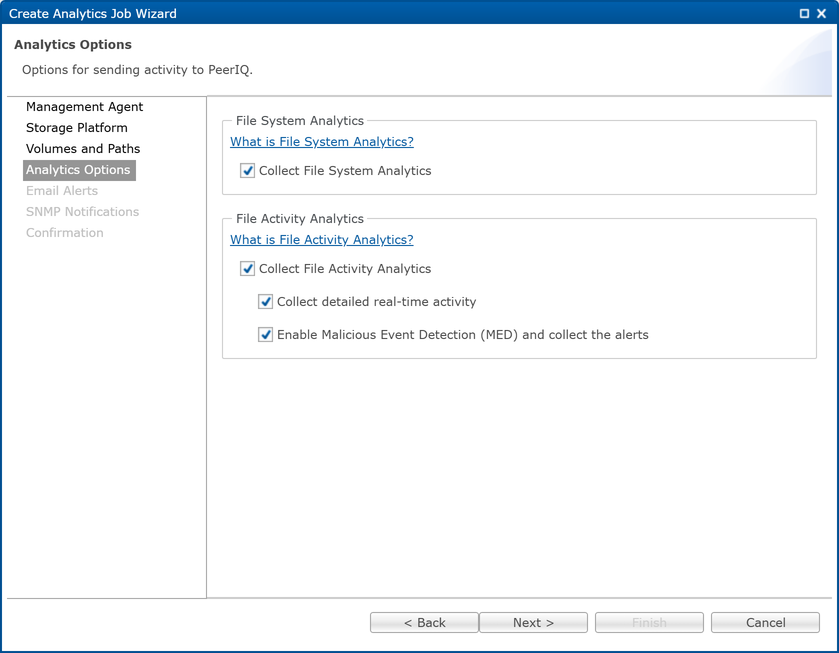
-
Click Next to proceed to the Email Alerts page.
Step 7. Email Alerts
This step is optional.
Email alerts notify recipients when certain types of events occur. Email alerts can be configured for the following events.
| Event Type | Description |
|---|---|
| Job Start | Sends an alert when the job starts. |
| Job Stop | Sends an alert when the job stops. |
| Job Failure | Sends an alert when the job stops because of an error condition. |
| Participant Failure | Sends an alert when an Agent used by the Analytics job becomes unavailable. |
| System Event | Sends an alert when an unexpected error or environmental condition affects the operation or status of the Analytics job. |
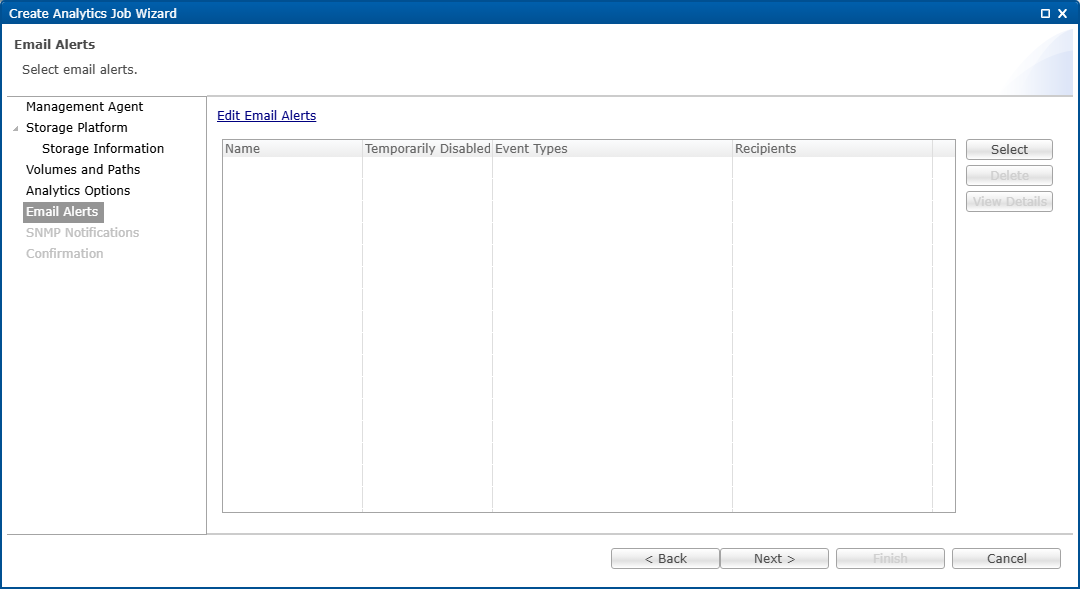
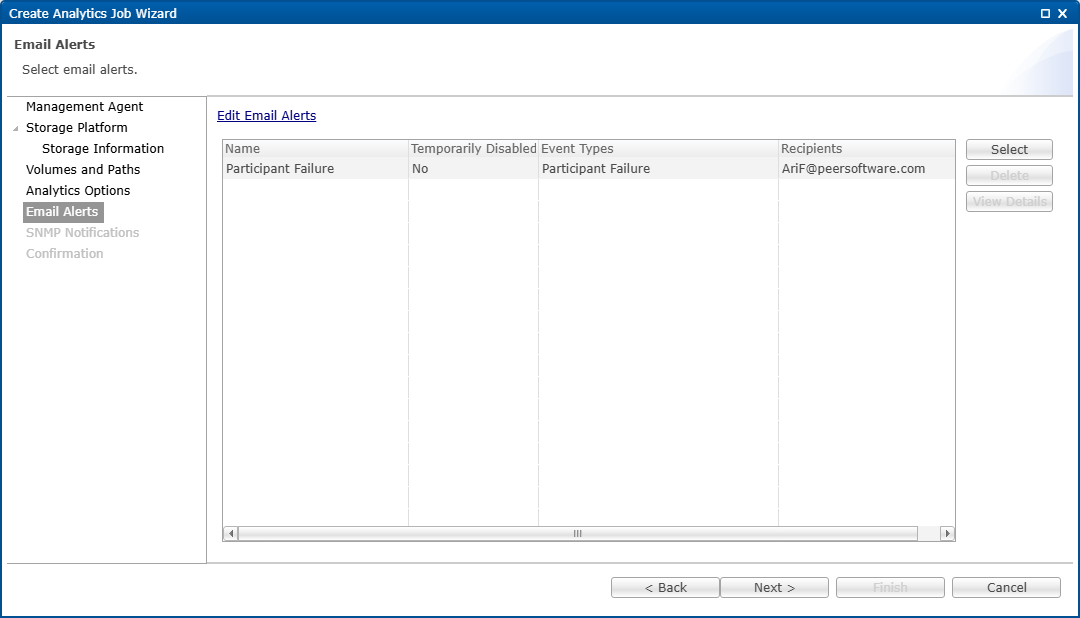
When you first create a job, the Email Alerts table in the wizard is empty. You can apply existing email alerts to the job or create new email alerts from this wizard page. Email alerts can also be predefined in Preferences and applied to multiple Analytics jobs.
![]()
Note: Before creating email alerts, configure the email server settings in Email Configuration under Preferences. For more information, see Email Configuration in the PeerGFS User Guide.
To create a new email alert:
-
Click Edit Email Alerts.
The Preferences dialog is displayed.
-
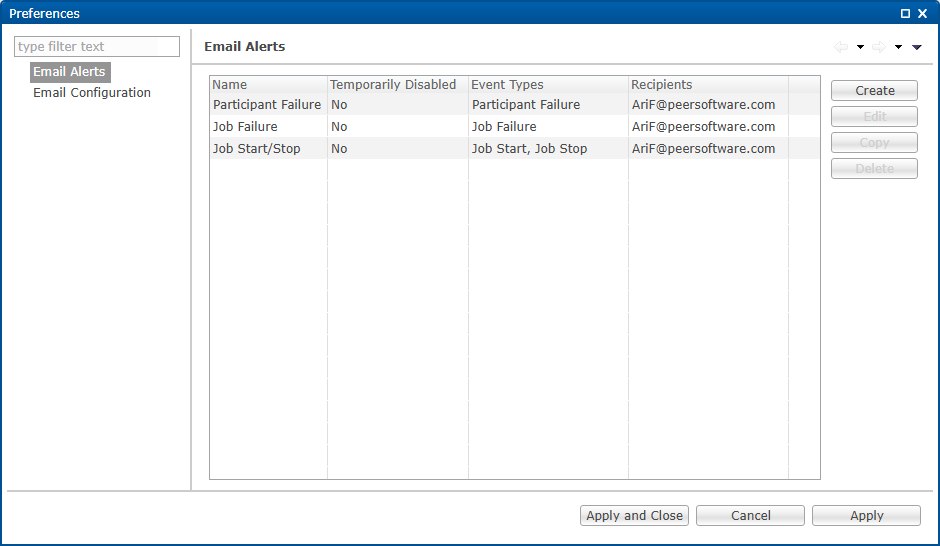
In the navigation tree, select Email Alerts if it is not already selected.
The Preferences dialog displays a table of existing alerts.
-
Click Create.
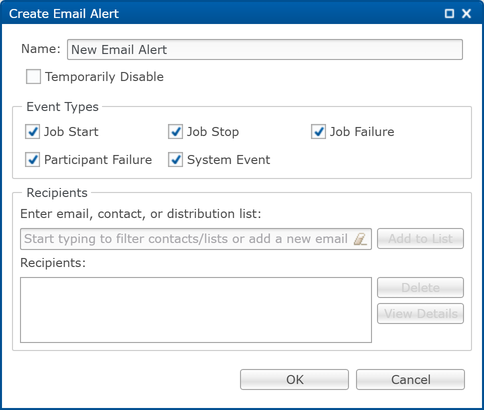
The Create Email Alert dialog is displayed.
-
Configure the email alert:
- Enter a name for the alert.
- Select the event types for the alert.
- Specify one or more recipients:
Enter the recipient’s email address, contact name, or select a distribution list.
Click Add to List. The recipient appears in the Recipients field.
Repeat as needed to add additional recipients.
-
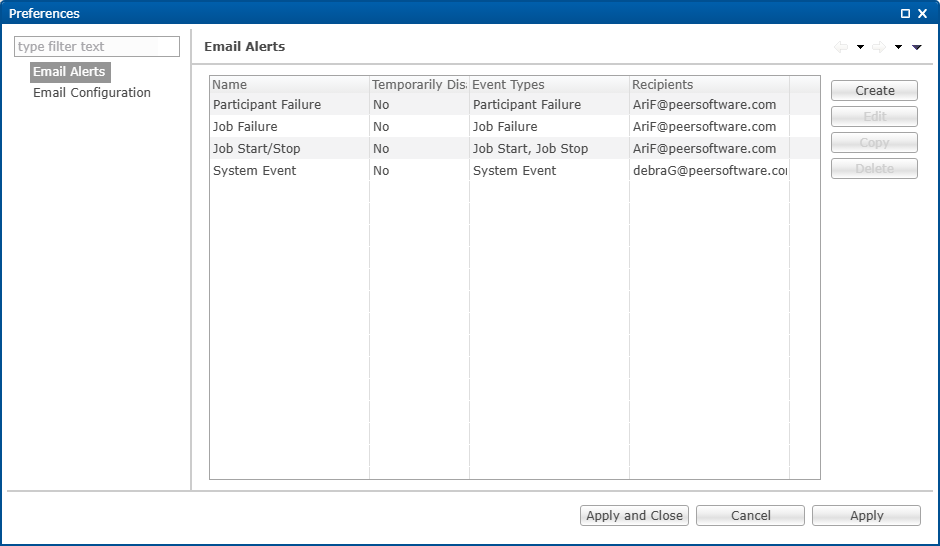
Click OK.
The email alert is added to the Email Alerts table in the Preferences dialog.
-
Repeat Steps 3–5 as needed to create additional email alerts.
-
Click Apply and Close.
The Preferences dialog closes and the Create Analytics Job wizard is redisplayed.
-
Proceed to the steps to apply an existing email alert to the Analytics job.
To apply an existing email alert to the Analytics job:
-
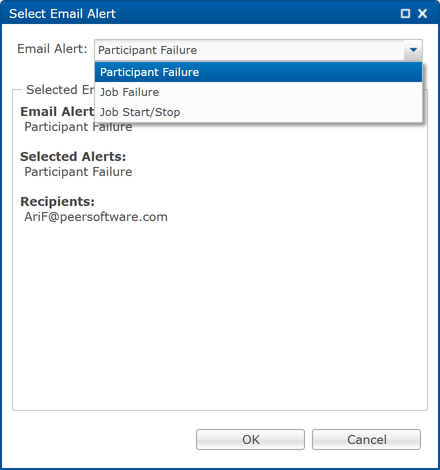
On the Email Alerts page, click Select.
The Select Email Alert dialog is displayed.
-
From the Email Alert list, select an email alert.
-
Click OK.
The selected email alert is added to the job’s Email Alerts table.
-
Repeat these steps as needed to apply additional email alerts to the job.
- Click Next to proceed to the SNMP Notifications page.
Step 8. SNMP Notifications
This step is optional.
SNMP notifications notify recipients when certain types of events occur. SNMP notifications can be configured for the following events:
| Event Type | Description |
|---|---|
| Job Start | Sends a notification when the job starts. |
| Job Stop | Sends a notification when the job stops. |
| Job Failure | Sends a notification when the job stops because of an error condition. |
| Participant Failure | Sends a notification when an Agent used by the Analytics job becomes unavailable. |
| System Event | Sends a notification when an unexpected error or environmental condition affects the operation or status of the Analytics job. |
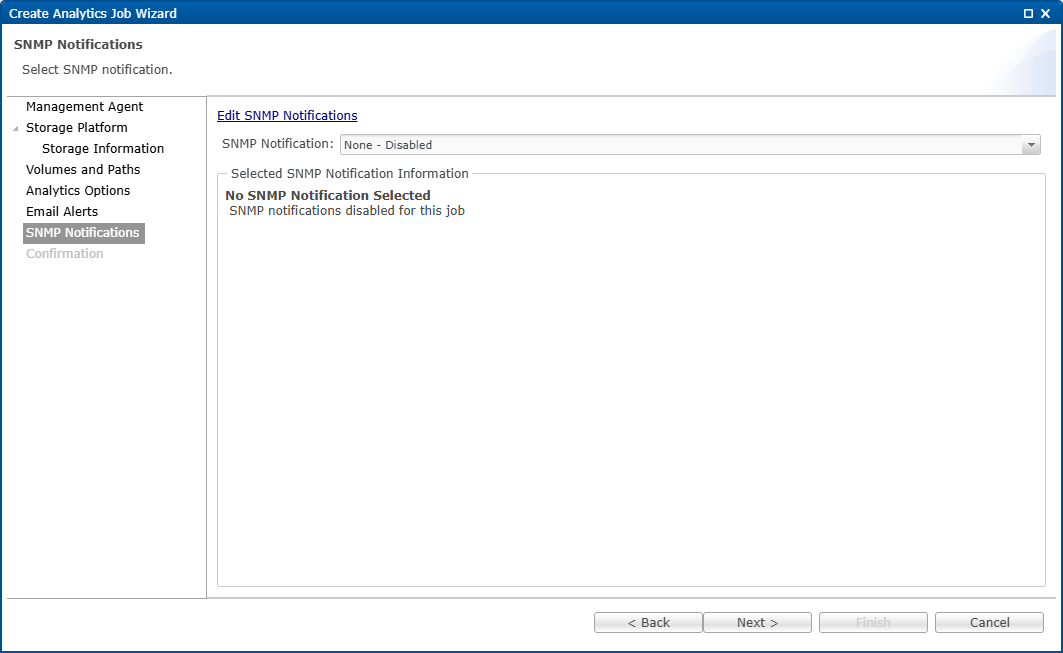
When you first create a job, SNMP notifications are disabled. You can apply an existing SNMP notification to the job from this wizard page. SNMP notifications are configured in Preferences and can be applied to multiple Analytics jobs.
Note: Before creating SNMP notifications, configure the SNMP settings in SNMP Configuration under Preferences. For more information, see SNMP Configuration in the PeerGFS User Guides.
To create a new SNMP notification:
-
Click Edit SNMP Notifications.
The Preferences dialog is displayed.
-
In the navigation tree, select SNMP Notifications if it is not already selected.
The Preferences dialog displays a table of existing SNMP notifications.
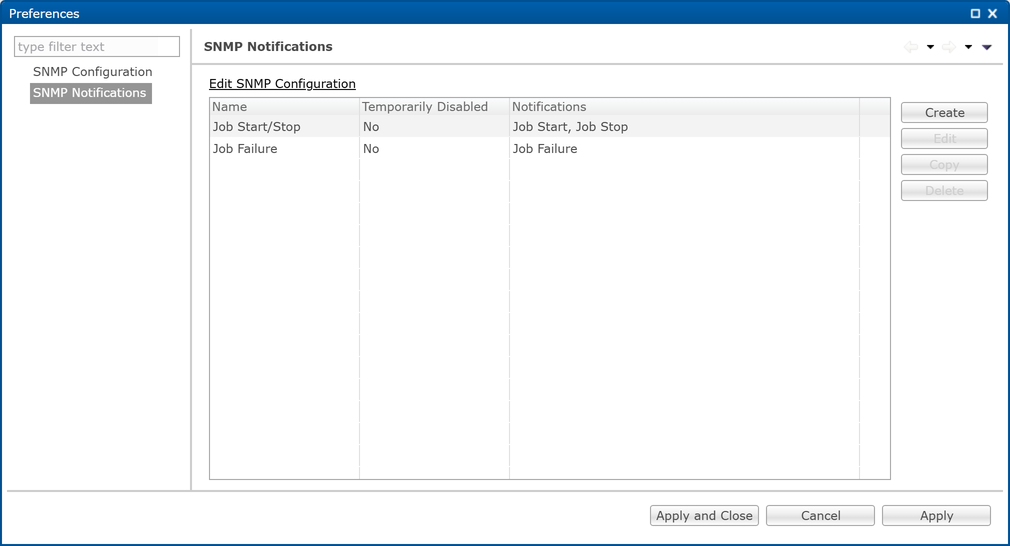
-
Click Create.
The Create SNMP Notification dialog is displayed.
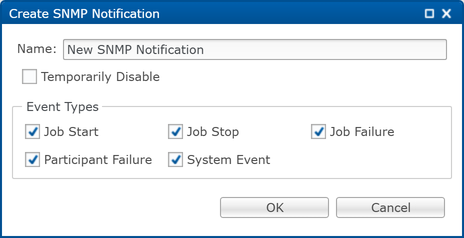
-
Configure the SNMP notification:
- Enter a name for the notification.
- Select the event types for the notification.
-
Click OK.
The SNMP notification is added to the SNMP Notifications table in the Preferences dialog.
-
Repeat Steps 3–5 as needed to create additional SNMP notifications.
-
Click Apply and Close.
The Preferences dialog closes and the Create Analytics Job wizard is redisplayed.
-
Proceed to the steps to apply an existing SNMP notification to the Analytics job.
To apply an existing SNMP notification to the Analytics job
-
From the SNMP Notifications list, select an SNMP notification.
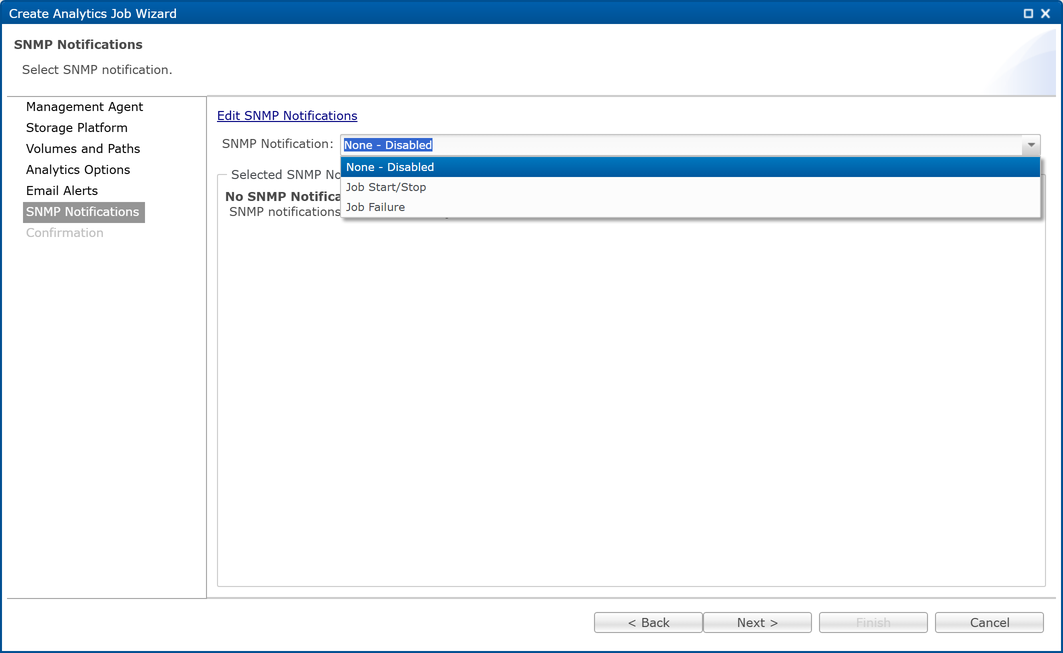
The selected SNMP notification is added to the job.
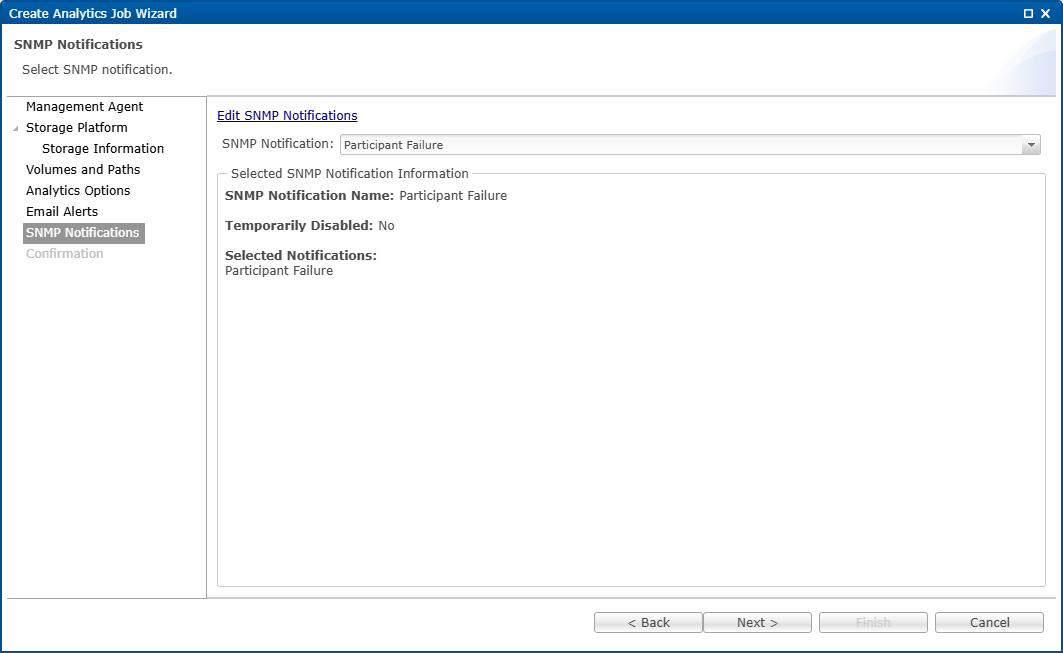
-
Click Next to proceed to the Confirmation page.
Step 9. Confirmation
The Confirmation page displays a summary of the Analytics job configuration settings
-
Review the job settings.
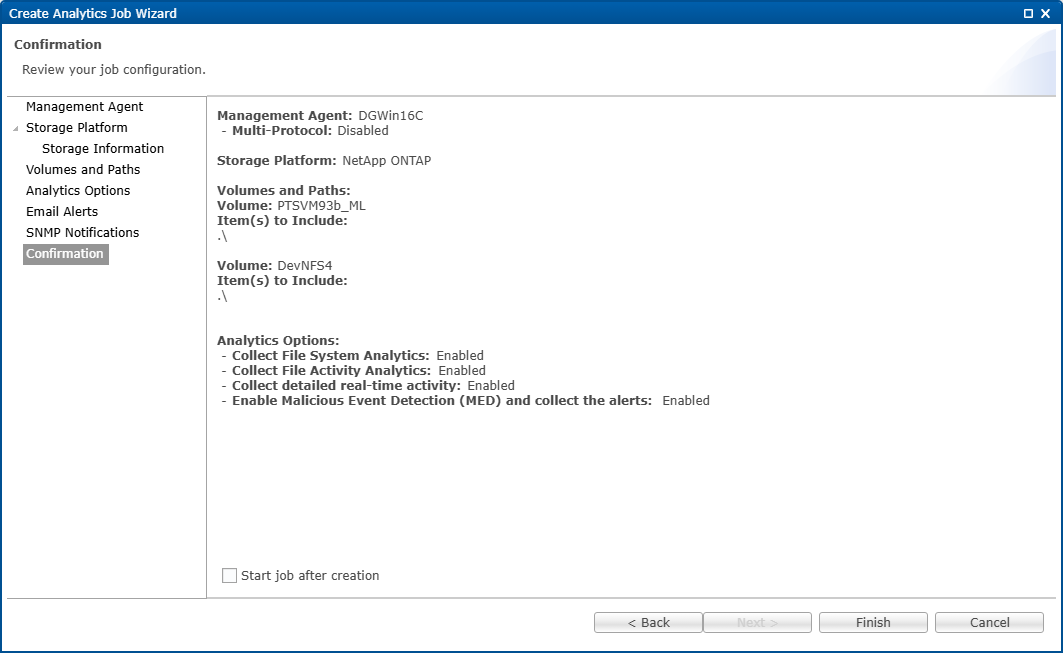
-
(Optional) Select Start job after creation to start the job after the wizard closes.
-
Click Finish.
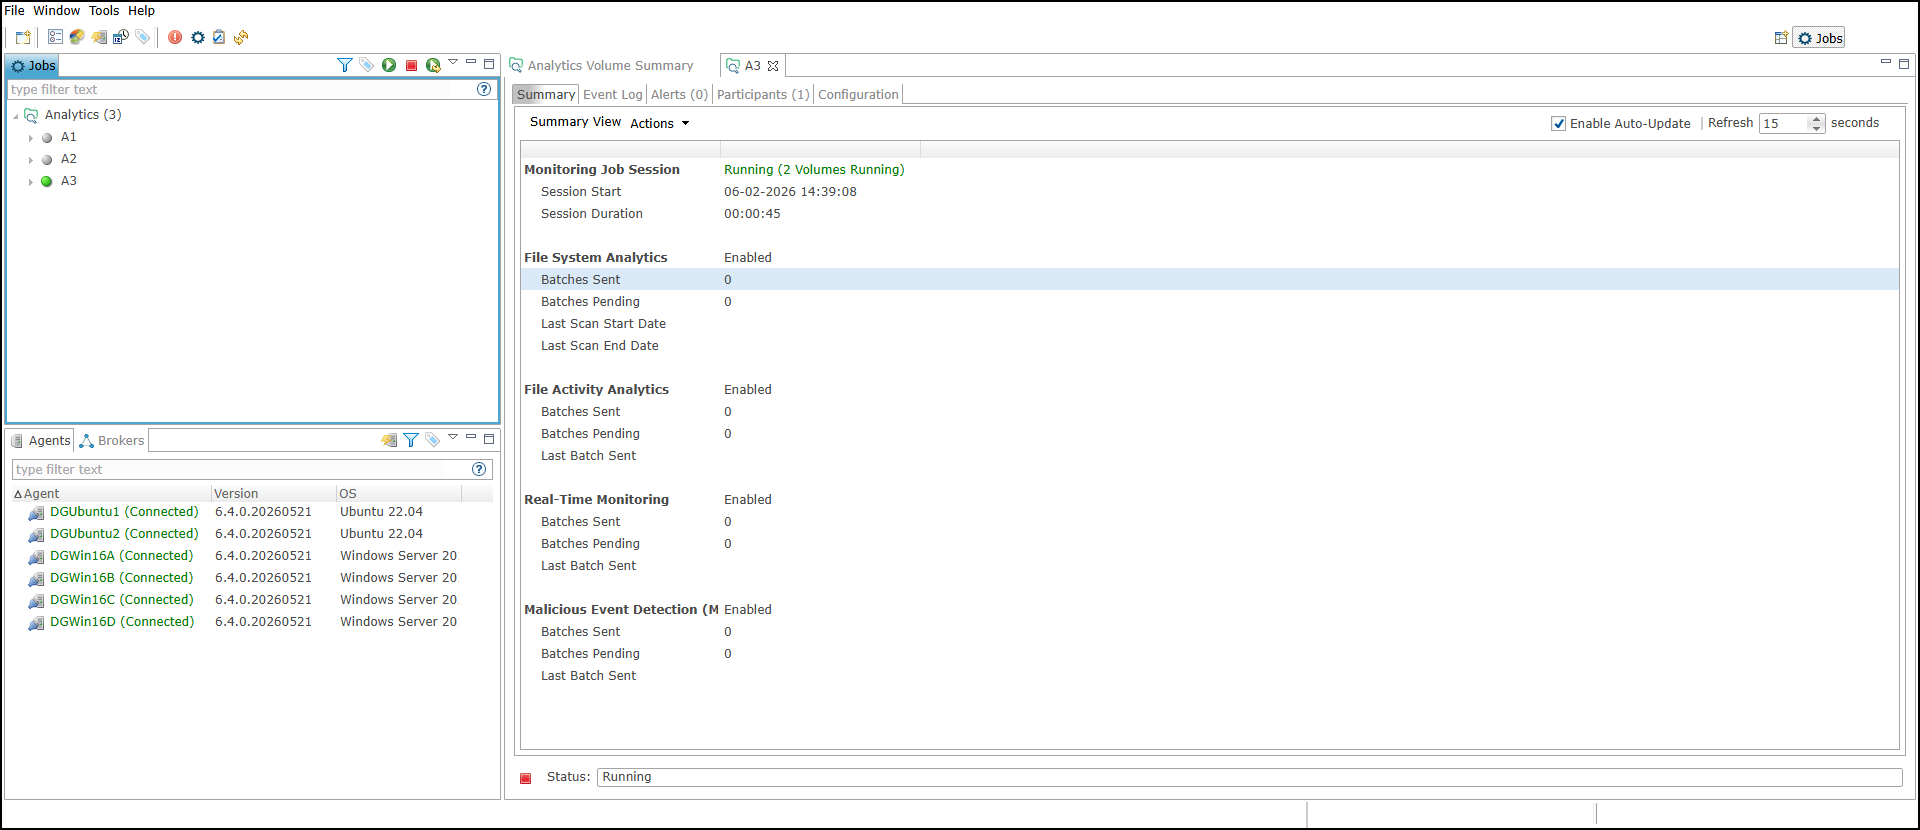
The wizard closes and the Analytics job is displayed in the Jobs view.
After You Finish
After the Analytics job is created, you can:
- View the Analytics job in the Jobs view.
- Review or modify the Analytics job settings.
- Monitor job status and alerts.
- Review collected Analytics data in PeerIQ dashboards and reports.
After the wizard closes, the Analytics job is displayed in the Jobs view. The Summary tab displays information about the Analytics job, including the monitoring status, enabled Analytics features, and current job status. Additional information and settings are available from the Event Log, Alerts, Participants, and Configuration tabs.