Analyzing File Activity
The following section describes the File Activity Analytics pages, which enable you to analyze file activity by users/clients accessing the file systems in your PeerGFS environment.
File Activity Analytics has three pages:
-
Users
-
Clients
-
Activty
Users Page and Clients Page
The following section of documentation applies to both the Users and Clients page.
The Users Page and Clients Page provides an overview of user and client activity across volumes monitored by PeerGFS. They summarize key file and folder operations, helping you track how data is being accessed and modified. The following activity is tracked:
| Activity Type | Description |
|---|---|
| Total | The sum of all file and folder activities. |
| File Attribute | Indicates that a file's attributes have been changed. For example, changing a document to read-only. |
| File Close | Indicates that a file is closed after being accessed or edited. For example, closing a Word document. |
| File Create | Indicates that a new file has been created. For example, saving a new file called "notes.txt". |
| File Delete | Indicates that a file has been removed. For example, deleting "old_document.docx". |
| File Open | Indicates that a file has been opened. For example, opening "budget.xlsx". |
| File Read | Indicates that a file's contents have been read. For example, viewing "report.pdf". |
| File Rename | Indicates that a file has been renamed. For example, renaming "draft.docx" to "final.docx". |
| File Security | Indicates that a file's permissions have been changed. For example, changing access rights to a document. |
| File Write | Indicates that file's contents have been changed. For example, editing and saving "slides.pptx". |
| Folder Attribute | Indicates that a folder's attributes have been changed. For example, setting a folder to hidden. |
| Folder Create | Indicates that a folder has been created. For example, creating a folder named "Projects". |
| Folder Delete | Indicates that a folder has been removed. For example, deleting the folder "Old_Backups". |
| Folder Security | Indicates that a folder's permissions have been changed. For example, changing access rights to a folder. |
| Folder Rename | Indicates that a folder has been renamed. For example, renaming "Photos_2024" to "ProductPics". |
Client Hostname or IP Address
PeerGFS normally records the hostname of the client performing an operation. However, in certain cases, this information may not be available.
Windows File Server Local Access
When a job is configured to work with a Linux File Server, PeerGFS cannot associate activity with a specific client hostname. This limitation exists regardless of the file being accessed via NFS or locally. In these cases, activity is shown as localhost.
Linux File Server
When a job is configured to work with a Linux File Server, PeerGFS cannot associate activity with a specific client hostname. This limitation exists regardless of the file being accessed via NFS or locally. In these cases, activity is shown as localhost.
Using the FAA Page Controls
You can customize the data displayed on the Users/Clients page using the controls at the top-right of the page:
-
Department: Filter the displayed data based on a user's department. This requires that your LDAP environment contains the 'department' attribute and that the
Resolve LDAP Information optionis enabled in PeerIQ's LDAP configuration.Note: This filtering applies only to Users, not Clients.
-
Activity: Filter the displayed data to show specific activity types. See the list of tracked activities above.
-
Start Date: Select the date from which to begin displaying data. For daily views, any date is valid. For weekly or monthly views, only Mondays can be selected.
-
Time Frame: Define the period of data to display, starting from the selected
Start Date.
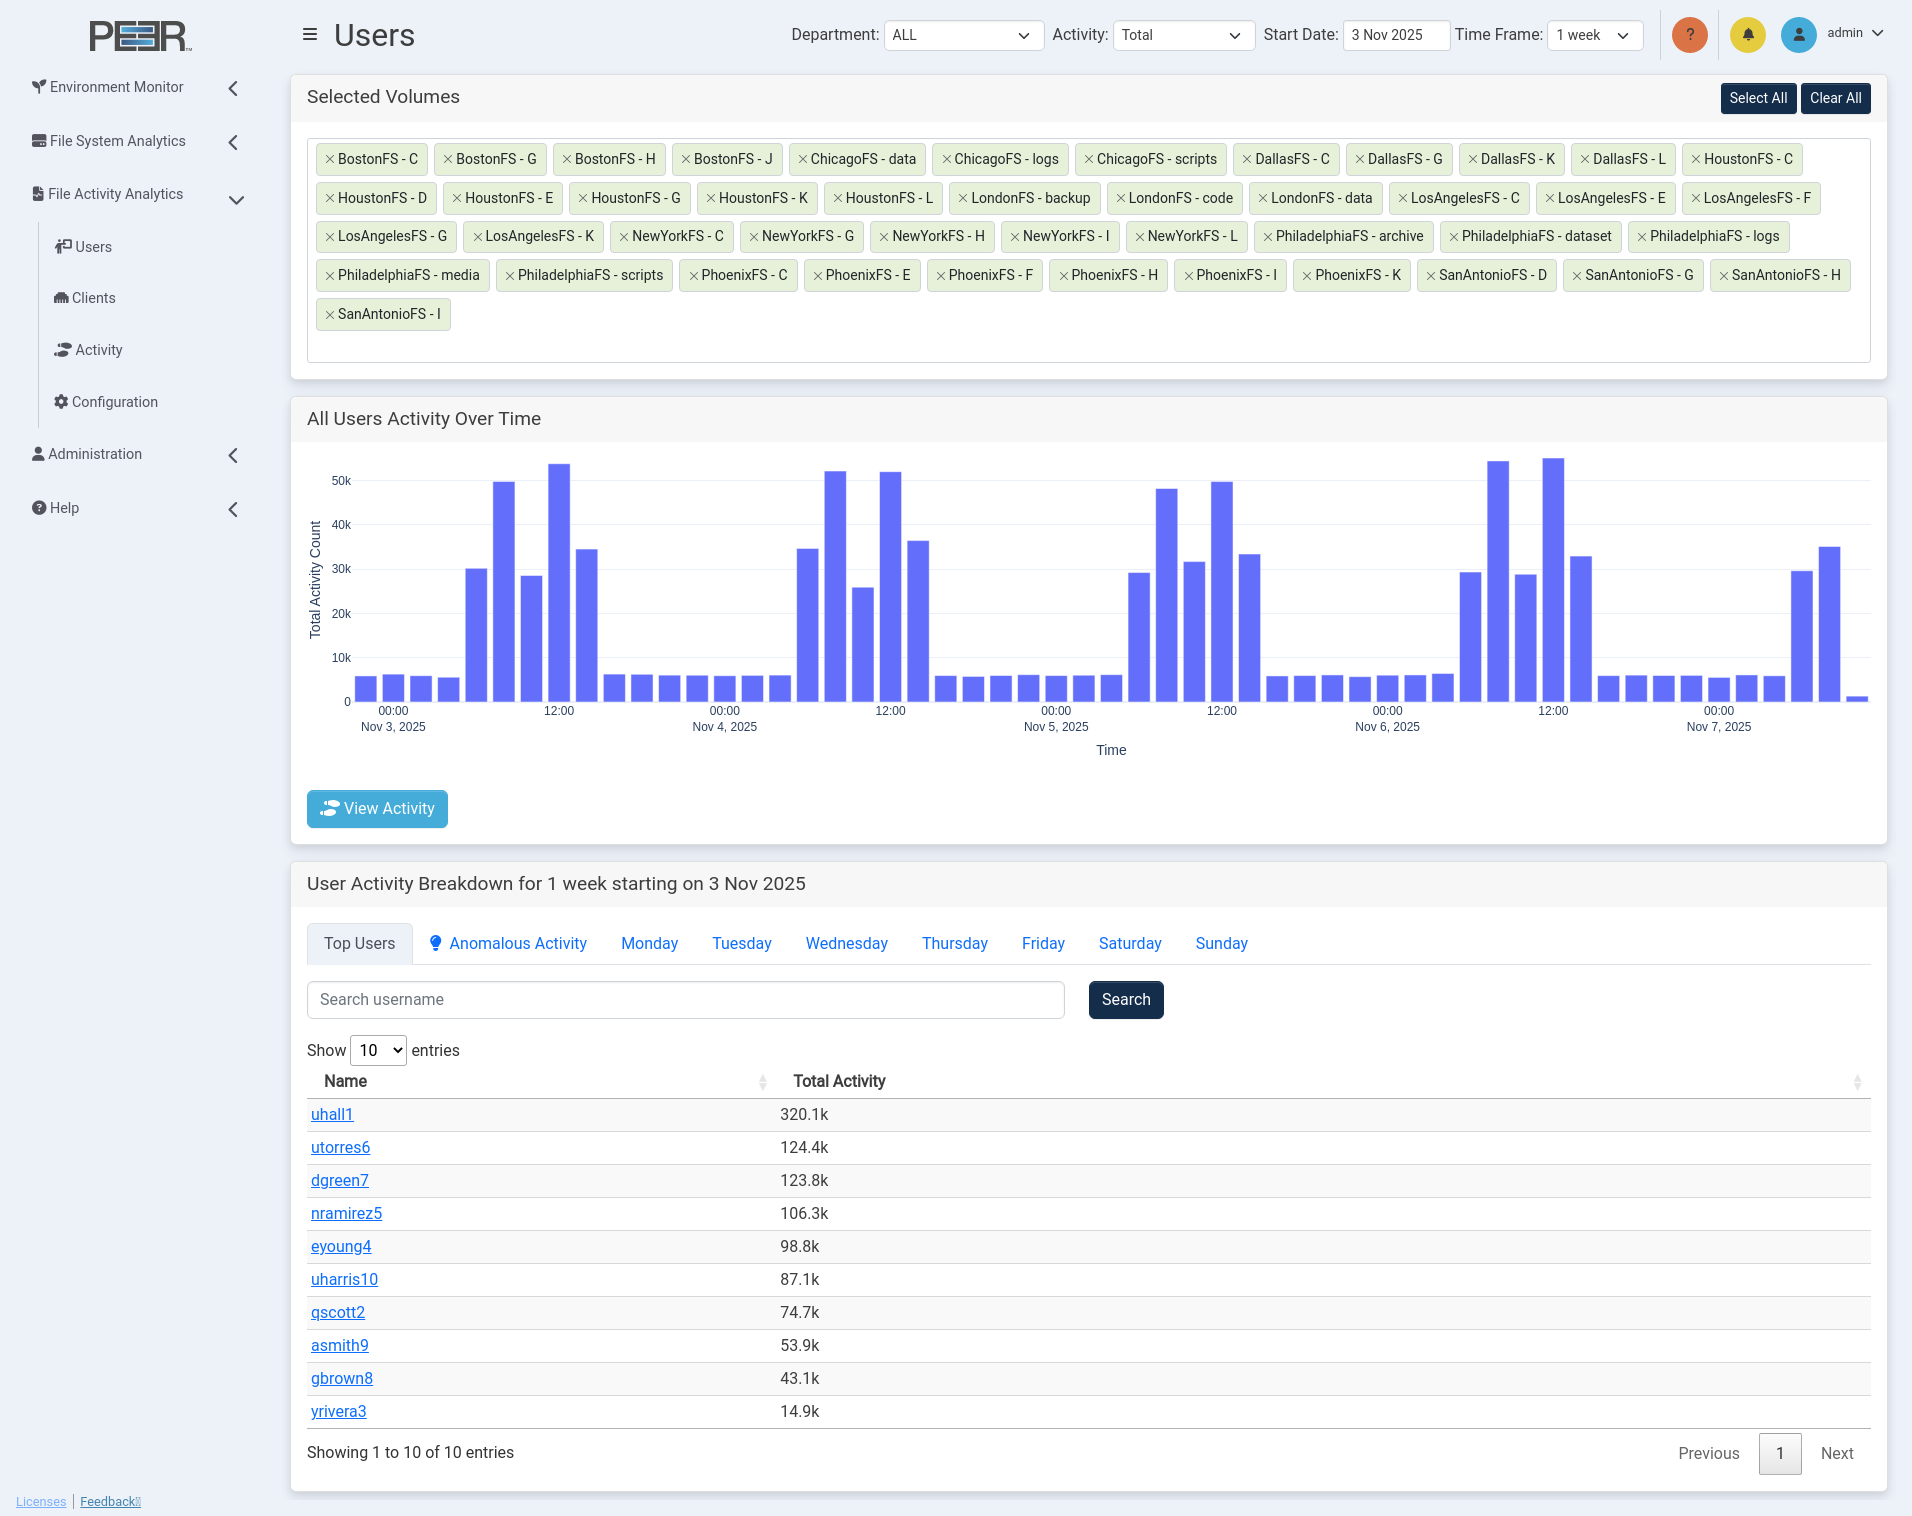
Users Page and Clients Page Cards
The Users page and Clients page includes several cards that provide a summarized view of user and client activity:
Selected Volumes
This card filters the volumes currently selected for analysis. Selected volumes are sorted into two categories: Recent Activity and No Recent Activity.
Recent Activity includes volumes with data from the most recent set of real-time statistics and are shown in green.
No Recent Activity includes volumes with no activity in the latest real-time statistics and are shown in white.
Modifying Volume Selection
Use these options to modify which volumes are selected:
Select All: Select all available volumes.
Clear All: Deselect all volumes.
Individual Volume Search: Search for and add a volume by typing the name in the Selected Volumes field and selecting the appropriate volume from the drop-down list.
Individual Volume Removal: Click the X next to a volume name to remove that specific volume.
All Users/Clients Activity Over Time
This card displays a trend chart showing user or client activity over time, based on the selected filters. The chart visualizes total activity across all monitored volumes and highlights fluctuations in user or client interactions within the selected time frame.
Hover over a data point to display detailed metrics for that specific interval, including the timestamp and corresponding activity count. This visualization helps identify patterns in usage, peak activity periods, and potential irregularities in user or client behavior.
View Activity
Clicking this button opens the Activity page with all filters preconfigured based on the current selections, providing a visual way to access the detailed activity view.
Users/Clients Activity Breakdown
This section provides a breakdown of user or client activity and includes multiple tabs for viewing filtered data. Each tab features a search box for locating a specific user or client. Enter part or all of a username or hostname and click Search to display matching entries. The table below updates automatically to reflect the filtered results.
Selecting a name from the table opens a detailed view for that specific user or client, allowing deeper analysis of activity trends and behaviors.
Top Users/Clients
The Top Users/Clients tab displays the most active users or clients based on the applied filters. Activities are ranked by total activity count, providing quick insight into which users or clients are generating the highest volume of file and folder operations.
Anomalous activity
The Anomalous Activity tab lists users or clients whose activity patterns deviate significantly from their normal behavior. Each entry includes an anomaly score, a numerical value indicating the degree of deviation. A higher score represents more unusual activity.
Note: A minimum of one month of historical data is required for any anomaly detection results. The more data available, the more precise the scoring becomes. Anomalous activity represents behavior that is statistically irregular but not necessarily indicative of a problem.
Top Users/Clients per break down
This view displays the top active users or clients according to the selected time frame.
- In a 4-week view, tabs display weekly user/client activity.
- In a 1-week view, tabs display daily user/client activity.
- In a 1-day view, tabs display 4-hour user/client activity blocks.
This hierarchical breakdown allows you to analyze user and client activity trends at varying levels of granularity.
User Activity Page and Client Activity Page
The User Activity Page and Client Activity Page provide a detailed analysis of activity performed by a specific user or client on volumes monitored within PeerGFS.
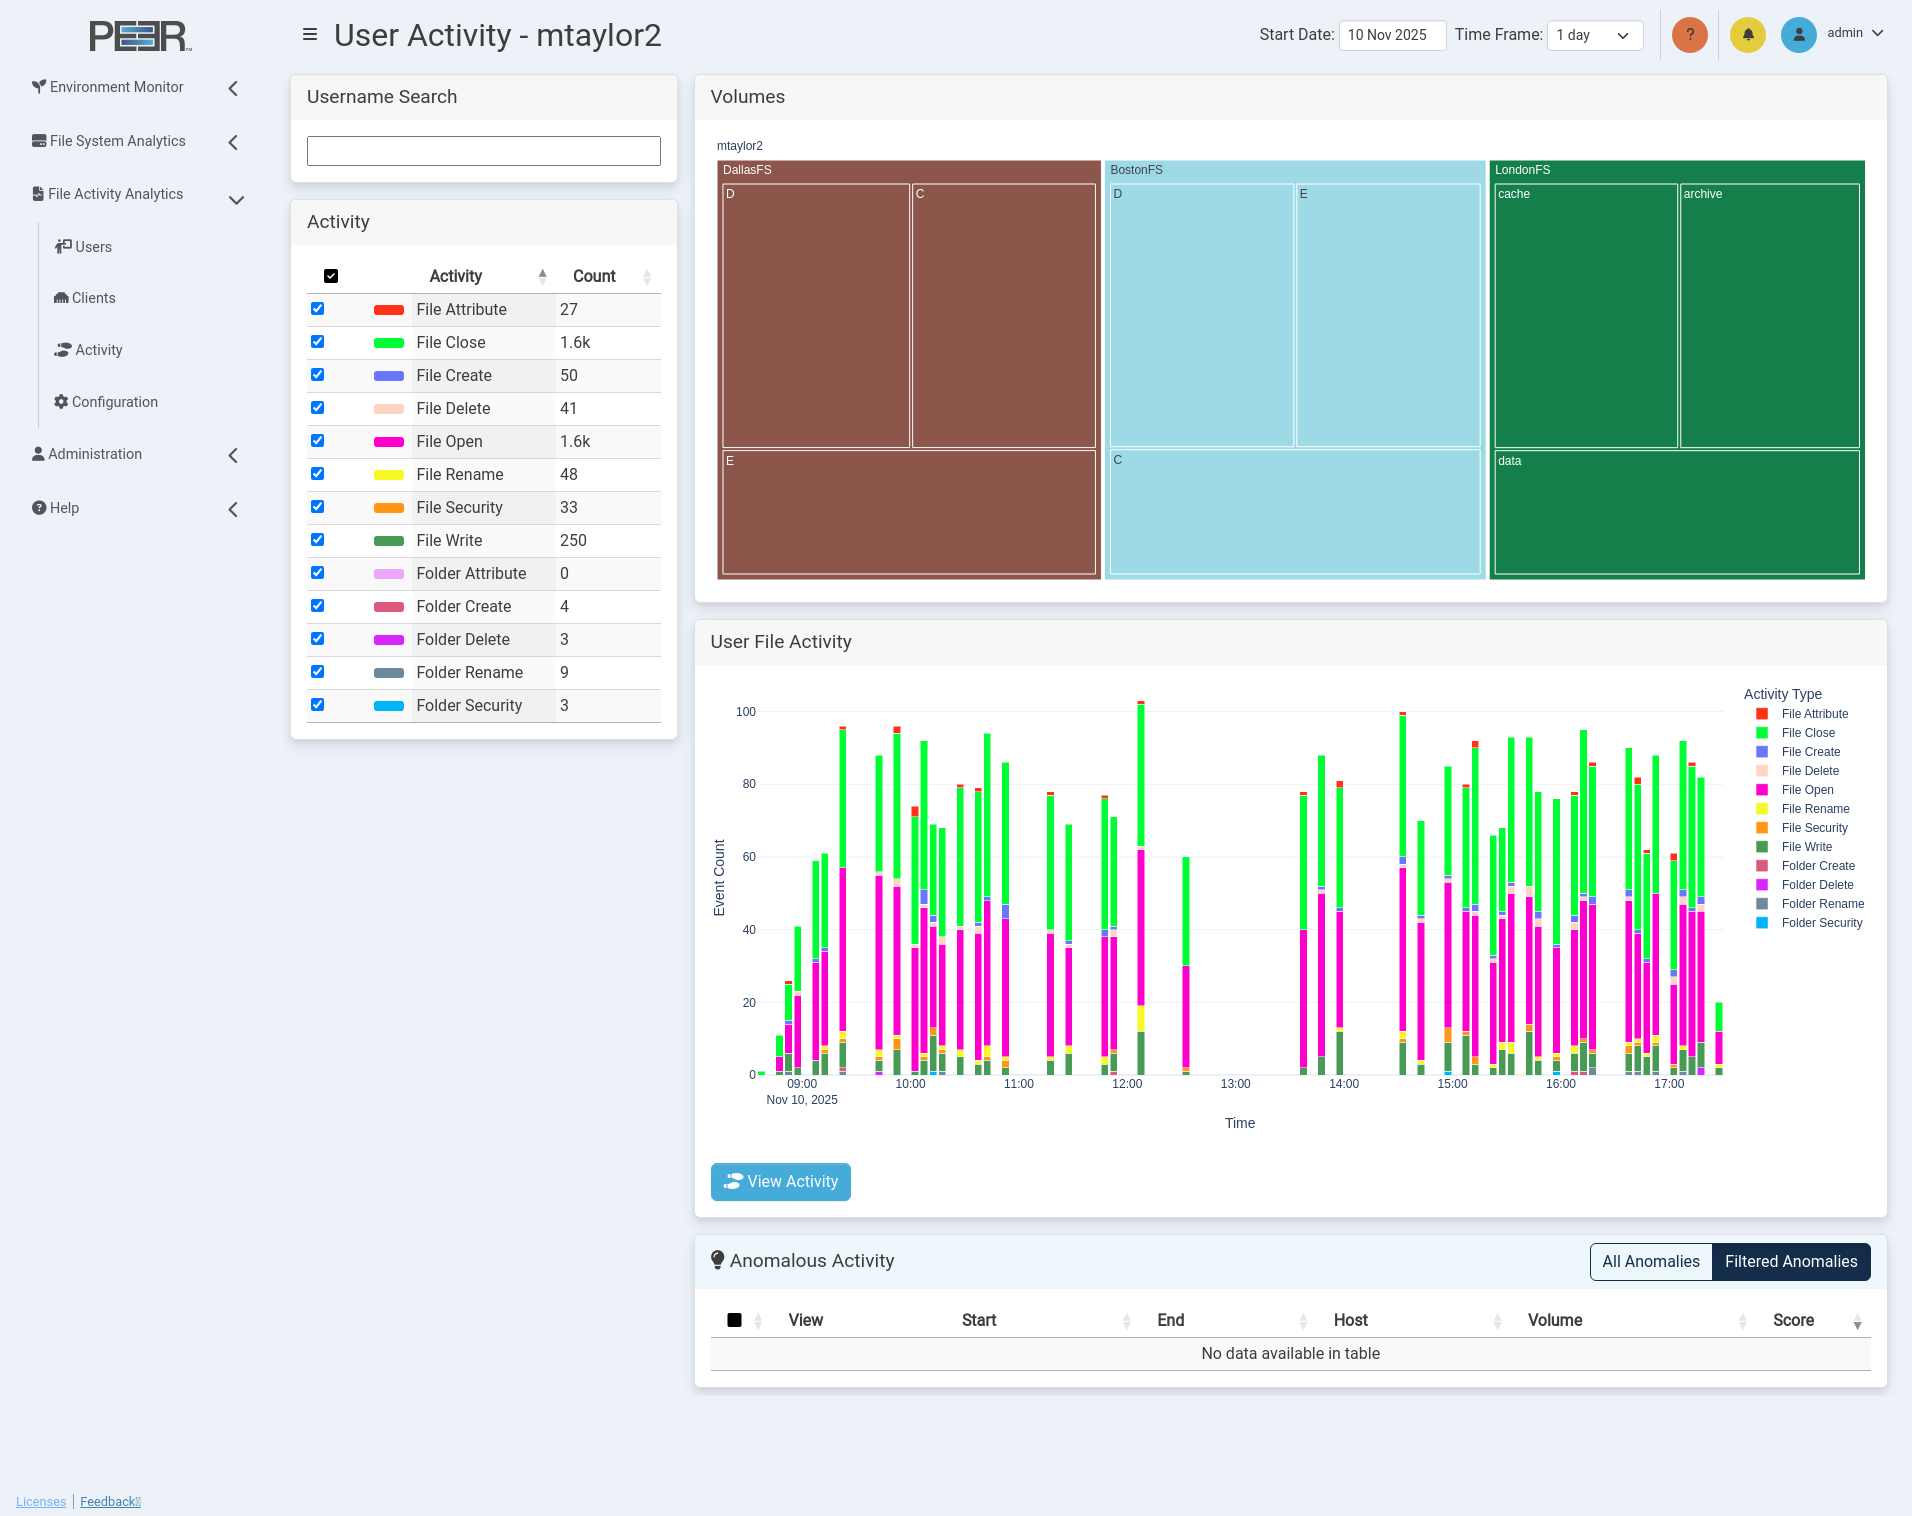
User Activity Page and Client Activity Page Cards
The User Activity Page and Client Activity Page contain five cards.
Username/Client Search
Provides a search field for selecting a user or client. Begin typing a username, hostname, or IP to see matching results. You can select a user/client from the drop-down list or enter the full username, hostname, or IP and press Enter. Note: If a user or client has no trackable activity on volumes being monitored by PeerGFS, they will not appear in the search results.
Volumes
Displays a treemap of volumes and shares that the selected user has accessed. If no user is selected, the card will indicate that no data is available. The treemap uses nested rectangles to represent volumes and shares, arranged from largest to smallest based on access. Each rectangle's size is proportional to the amount of file activity it represents.
- Click a nested volume or folder within the treemap to focus on that volume or folder. The page will update to show file activity for the selected item.
- Click again on the same volume or folder to return to the previous treemap view.
Activity
Lists all activity types tracked for the selected user. You can toggle activity types on or off to adjust the data shown in other cards.
User/Client File Activity Events
Shows a bar chart of the selected user's or client's activity at the selected treemap level. The chart breaks down the number of events over the selected time frame. If no user or client is selected, this card shows "No Data Available."
View Activity
Clicking this button opens the Activity page with all filters preconfigured based on the current selections, providing a visual way to access the detailed activity view.
Anomalous Activity
The Anomalous Activity tab identifies users or clients whose file activity patterns deviate significantly from their typical behavior. This enables administrators to quickly detect unusual or potentially suspicious activity across monitored volumes. While anomalies highlight unusual behavior, they may result from legitimate user actions such as bulk file transfers, maintenance operations, or software updates.
Note: The Anomalous Activity tab is available only with a PeerIQ Advanced license. If your installation does not include this license, the table will appear empty.
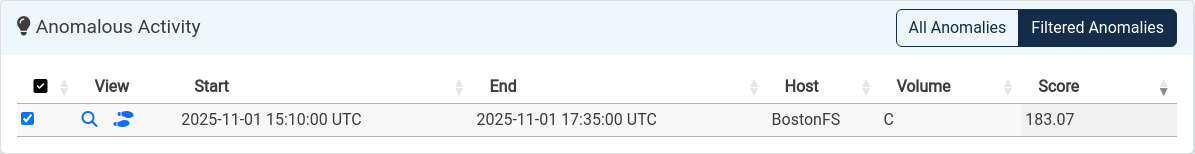
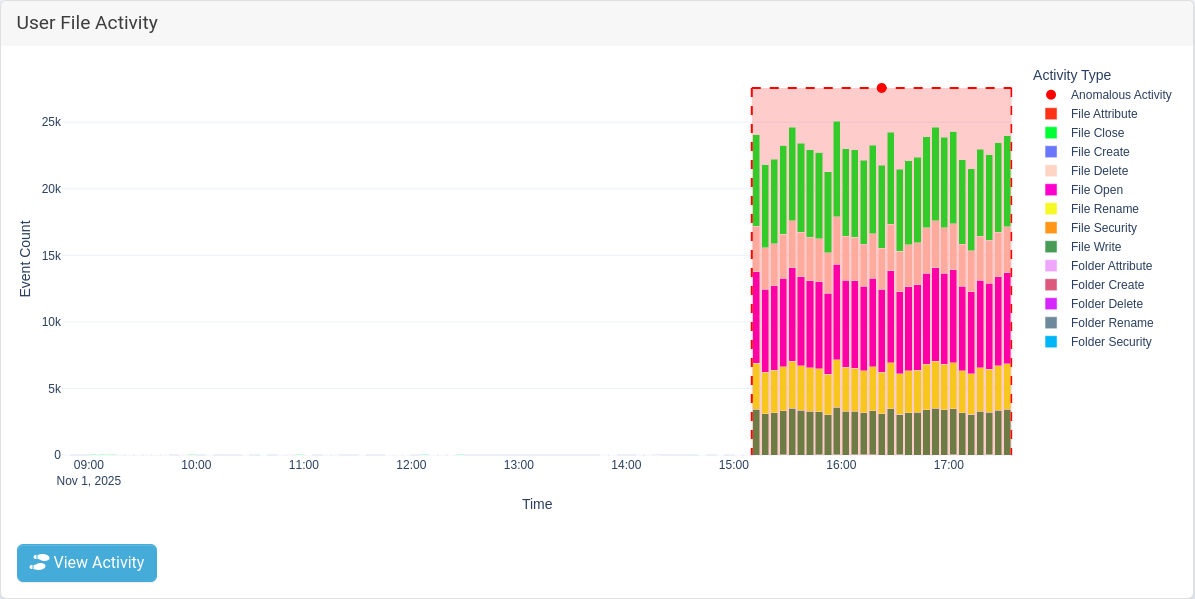
Each entry in the Anomalous Activity table includes the following information:
- View: Clicking the magnifying glass icon updates the User File Activity graph and the Volumes treemap to display the selected anomaly in detail. The highlighted anomaly is outlined with a red dashed box and marked by a red circle, as shown in the example below.
-
Footprints: Clicking the footprints icon automatically applies all related filters to generate a detailed activity report. This report provides a full breakdown of all file and folder operations that occurred during the anomaly window.
-
Start and End Time: Indicates the time range of the anomaly. An anomaly can last for any duration, with a minimum of five minutes.
-
Host and Volume: Displays the host system and volume where the anomalous activity was detected.
-
Anomaly Score: Represents the numerical deviation from normal user or client behavior. Higher scores indicate a greater degree of unusual activity.
The page contains two tabs that determine which anomalies are displayed:
-
Filtered Anomalies: Displays anomalies that match the currently applied filters and controls at the top of the page.
-
All Anomalies: Displays the top 10 anomalies recorded for the selected user or client, regardless of applied filters.