Analyzing Your File Systems
The following section describes the File System Analytics pages. These pages provide details about the file systems in your PeerGFS environment.
The four File System Analytics pages are:
-
Extensions
-
Data Aging
-
Hot Data Analysis
-
Scans
Using the FSA Page Controls
Several of the File System Analytics pages feature data visualizations such as line graphs, pie charts, and treemaps. Use the controls located in the upper right corner of the page to adjust the displayed information:
-
Files/Logical Size/Physical Size: Select the type of data to display, such as the number of scanned files, the logical size of scanned files, or the physical size on disk of scanned files.
-
Group by Extension/Group by Type: Select whether to display data grouped by file extension or file type.
-
Modified/Access: Select whether to display data based on the last modified or last accessed times of each scanned file.
More detailed information is provided on individual pages.
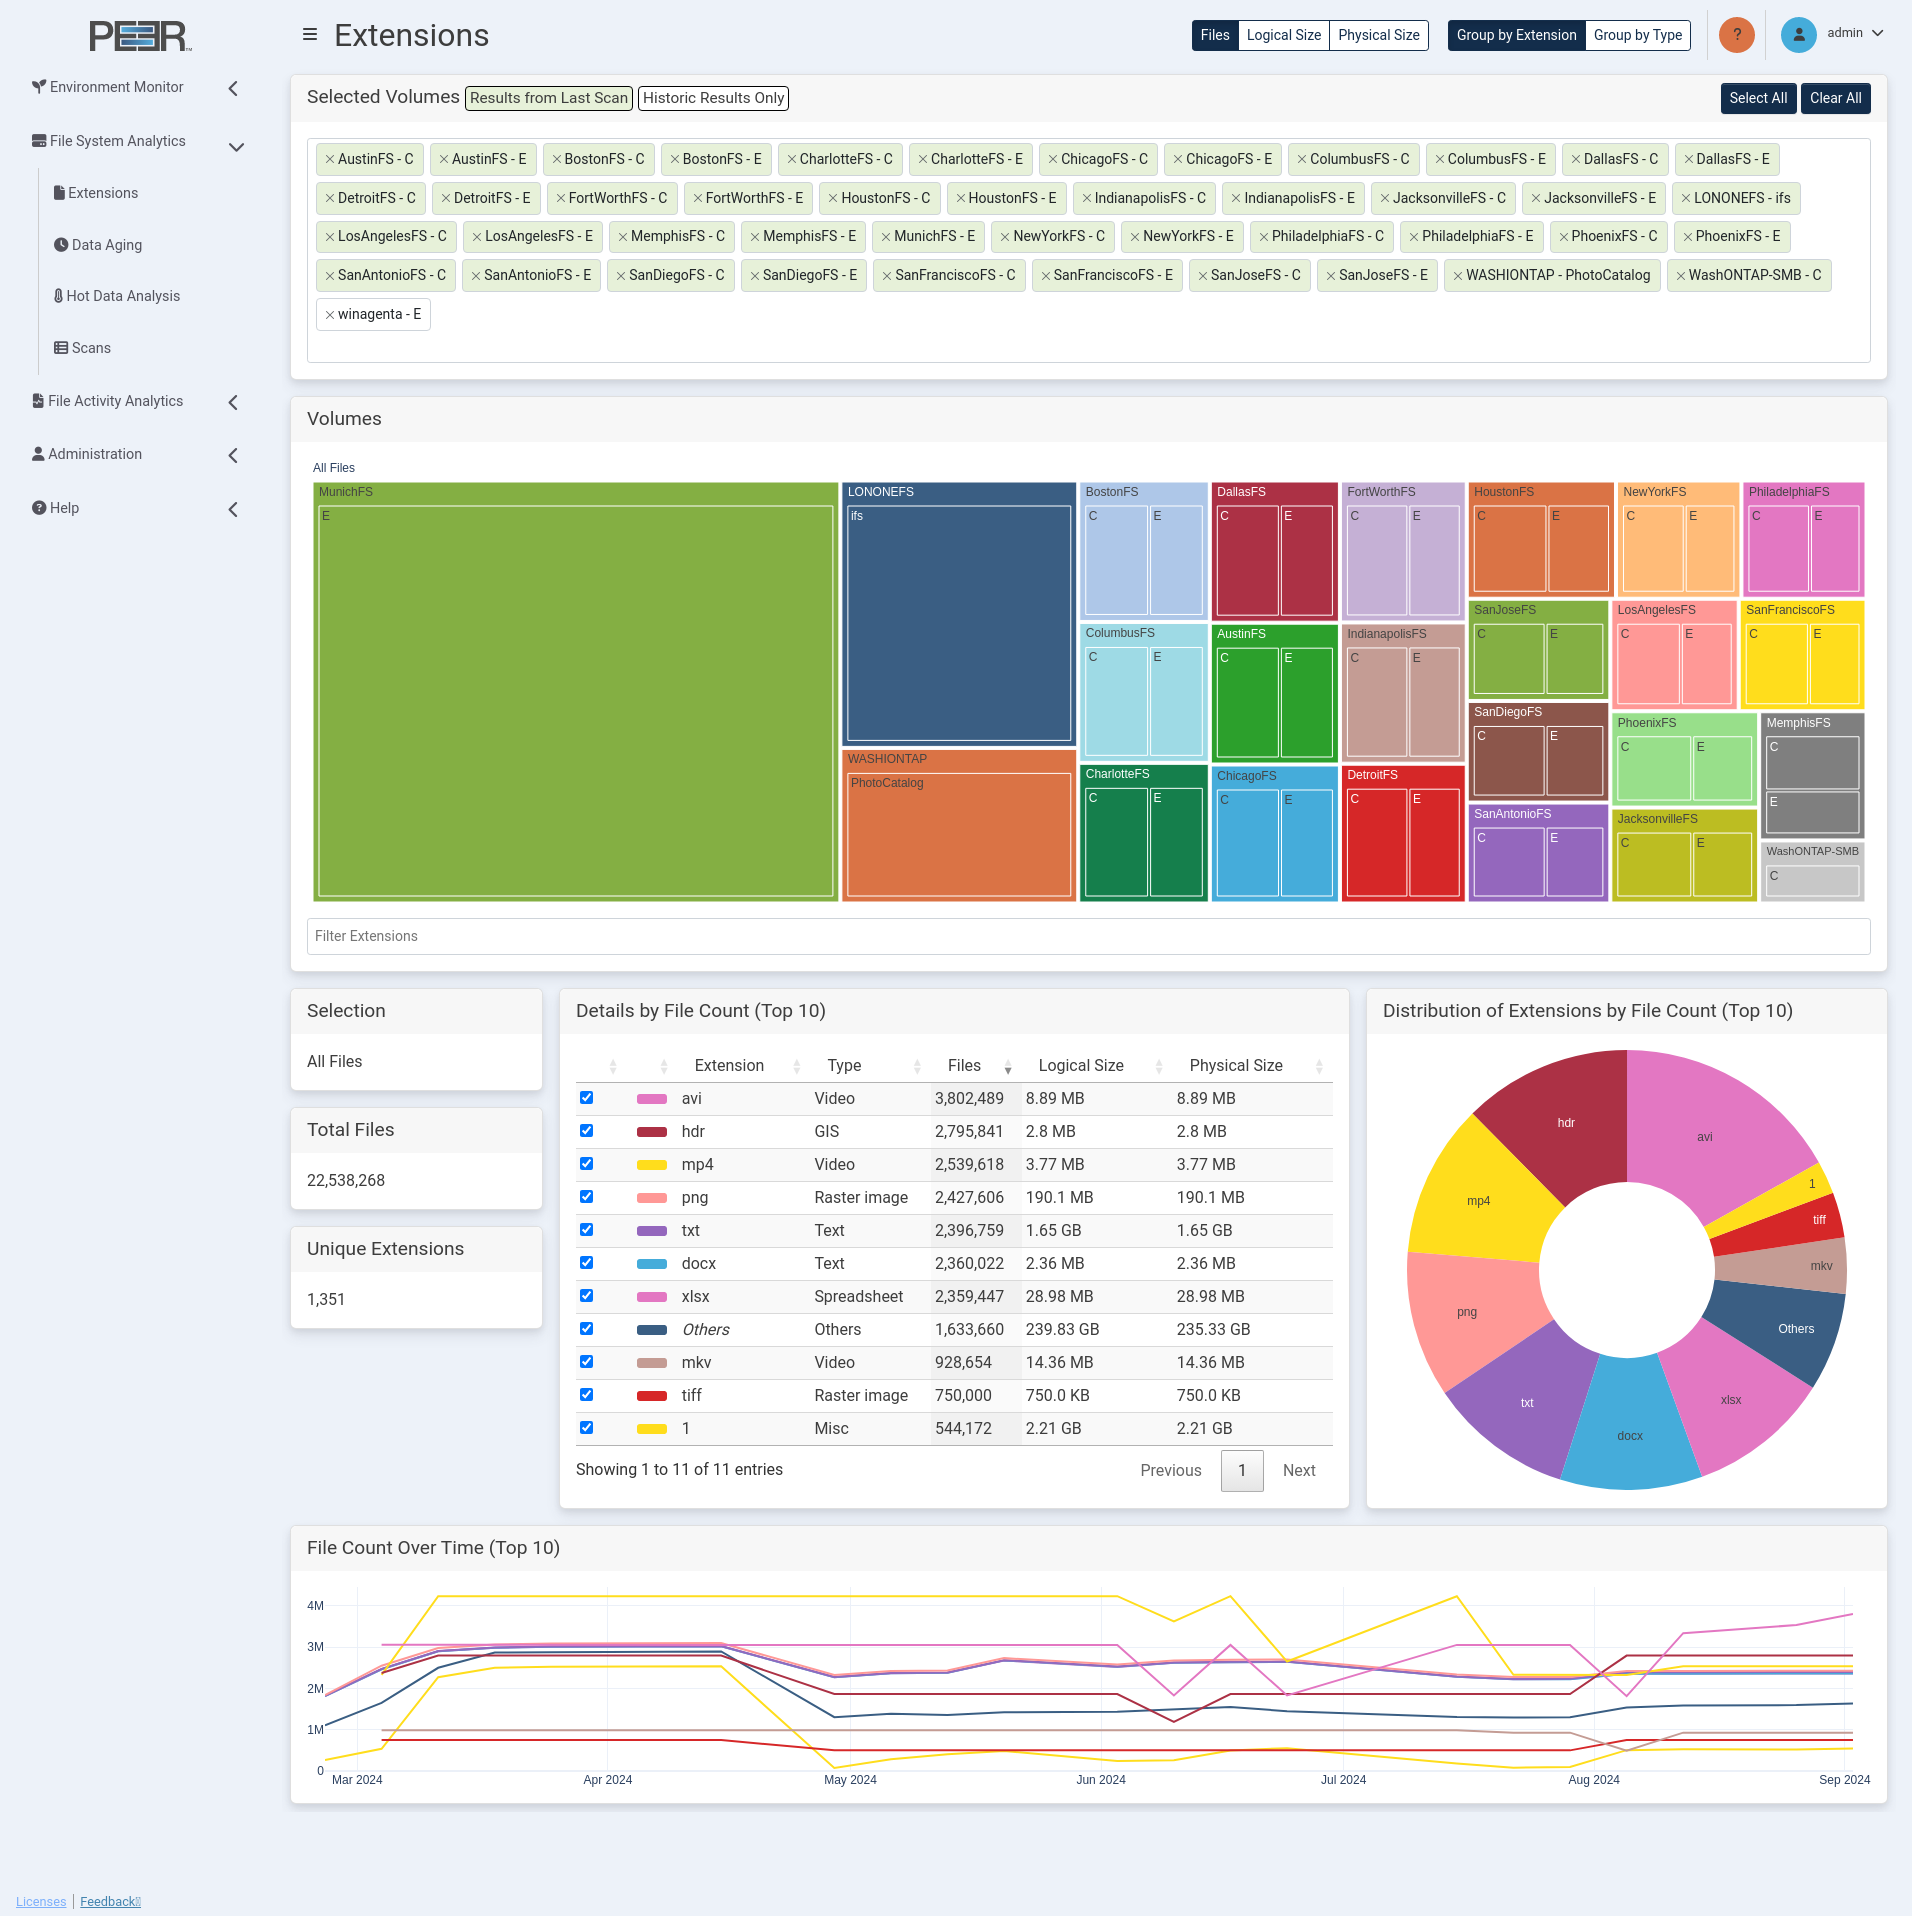
Extensions Page
The Extensions Page displays a breakdown of the file extensions in use across your PeerGFS environment.
Extensions Page Cards
The Extensions page contains seven cards:
| Card | Description |
|---|---|
| Selected Volumes | This card filters the volumes currently selected for analysis. Selected volumes are sorted into two categories: Results from Last Scan and Historic Results Only. Volumes with recent scans are shown in green, while volumes with no recent scans are shown in white. These white-labeled volumes do not contribute to page elements displaying current data but are included when analyzing historic trends. Use these options to modify which volumes are selected: • Select All: Select all available volumes. • Clear All: Deselect all volumes. • Individual Volume Search: Search for and add a volume by typing the name in the Selected Volumes field and selecting the appropriate volume from the drop-down list. • Individual Volume Removal: Click the X next to a volume name to remove that specific volume. |
| Volumes | Displays a treemap of storage devices across the PeerGFS environment and their volumes. The treemap uses nested rectangles, arranged from largest in the top left to smallest in the bottom right, to visualize storage volumes. Each nested rectangle represents a volume, with size proportional to the data it represents. The size of each volume in the treemap is determined by either the total number of files or the total size of the files, depending on the Group By controls selected at the top of the page. The colors of the rectangles indicate the percentage of storage used, with the adjacent color scale identifying the percentage. Each storage device in the treemap has its own color. If a storage device also hosts an Agent, the color will be consistent across the PeerIQ interface. • Click a nested rectangle to focus on that volume. The other cards will be updated to show data only for the selected item. Click again to return to the previous treemap view. • Hover over an element within the treemap to display the total number of files, the total logical size, and the total physical size, and for the current selection. Use the Filters Extensions dropdown below the treemap to filter the data on the page to show only selected file extensions or extension types, based on the controls selected at the top of the page. The dropdown displays all file extensions or extension types present within the PeerGFS environment. |
| Selection | Identifies which element is selected in the treemap. |
| Total Files | Displays the total number of files in the current selection. |
| Unique Extensions or Unique Extension Types | Displays the total number of unique extensions or extension types, based on the Group By controls selected at the top of the page. |
| Details by File Count (Top 10) or Details by File Logical Size (Top 10) or Details by File Physical Size (Top 10) | Displays a table of the extensions or extension types within the currently selected volumes, based on the Group By controls selected at the top of the page, as well as the Files/Logical Size/Physical Size controls. The table shows the top 10 extensions or extension types when no filter is applied; otherwise, it displays those that match the filter. Click any column heading to sort by that column. Toggle the checkbox in the first column to show or hide the segments in the pie chart and the traces in the line graph. The table displays the following information for each extension or extension type: • Color: The color used to identify the corresponding segment in the pie chart and trace in the line graph matching this extension or extension type. • Extension: Displays the file extension. The value Others represents extensions outside of the top 10, and No Extension represents files without a file extension. This column is only shown when Group by Extension is selected. • Type: The file type category. • File: The total number of files for this extension or type. • Size: The total size of the files with this extension or type. |
| Distribution of Extensions by File Count/File Logical Size/File Physical Size (Top 10) or Distribution of Extension Types by File Count/File Logical Size/File Physical Size (Top 10) | Displays a pie chart showing the distribution of extensions or extension types within the currently selected volumes, based on the Group By controls selected at the top of the page, as well as the Files/Logical Size/Physical Size controls. The colors in the pie chart correspond to those indicated in the Details table. |
| File Count/File Logical Size/File Physical Size Over Time (Top 10) | Displays a line graph of the top 10 extensions or extension types within the currently selected volumes, based on the Group By controls selected at the top of the page, as well as the Files/Logical Size/Physical Size controls. This chart illustrates trends over time, with line colors corresponding to those indicated in the Details table. |
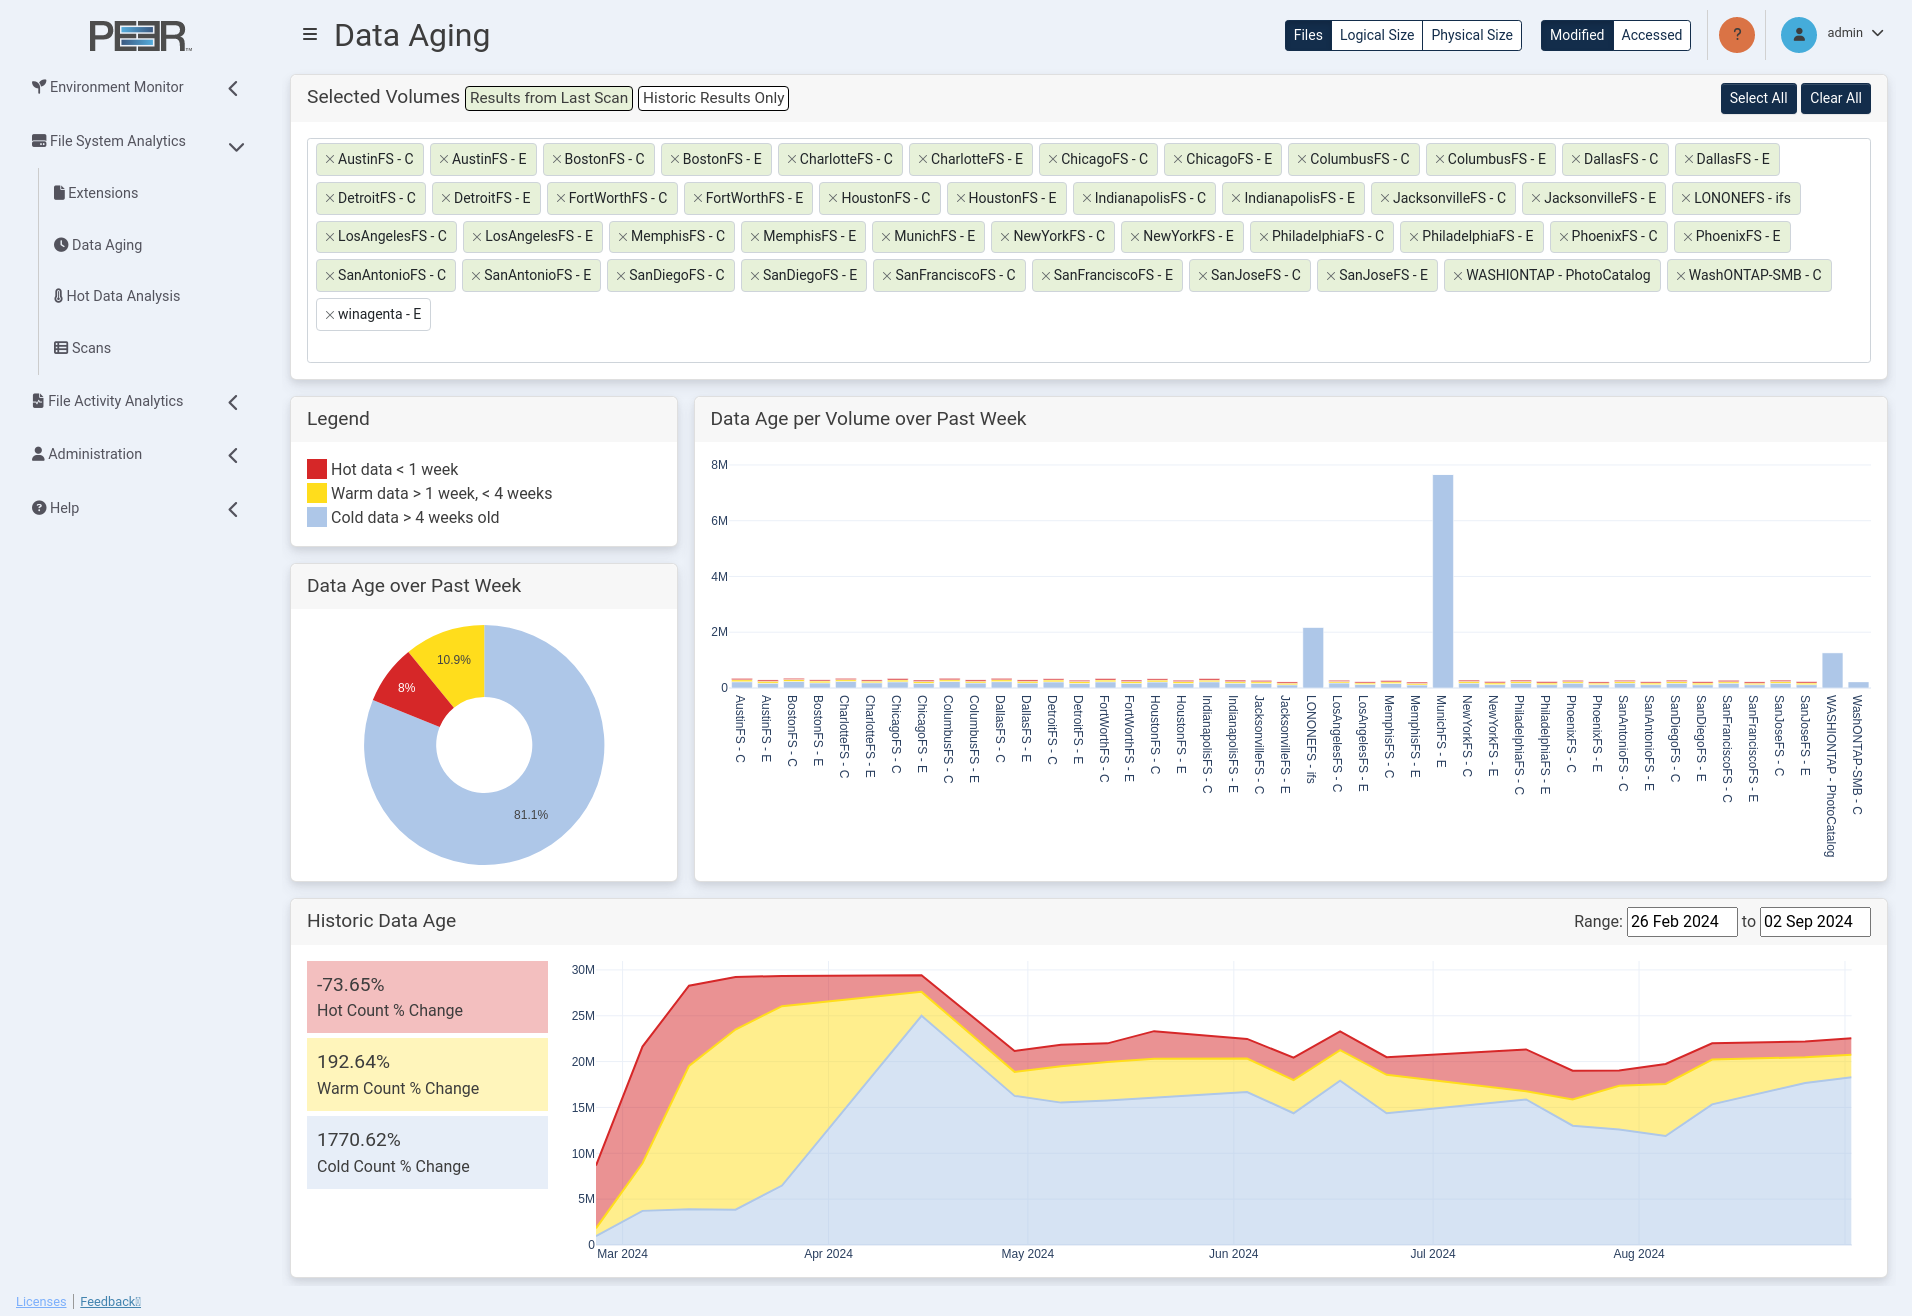
Data Aging Page
The Data Aging page provides a detailed overview of data age within the PeerGFS environment. Data age refers to the time that files on your system were last accessed or modified. Hot data refers to files that have been recently used, whereas cold data refers to files that are infrequently used.
Data Aging Page Cards
The Data Aging page contains five cards:
Selected Volumes
This card filters the volumes currently selected for analysis. Selected volumes are sorted into two categories: Results from Last Scan and Historic Results Only. Volumes with recent scans are shown in green, while volumes with no recent scans are shown in white. These white-labeled volumes do not contribute to page elements displaying current data but are included when analyzing historic trends.
Use these options to modify which volumes are selected:
- Select All: Select all available volumes.
- Clear All: Deselect all volumes.
- Individual Volume Search: Search for and add a volume by typing the name in the Selected Volumes field and selecting the appropriate volume from the drop-down list.
- Individual Volume Removal: Click the X next to a volume name to remove that specific volume.
Legend
Illustrates the color associated with each data age range and specifies the corresponding data range.
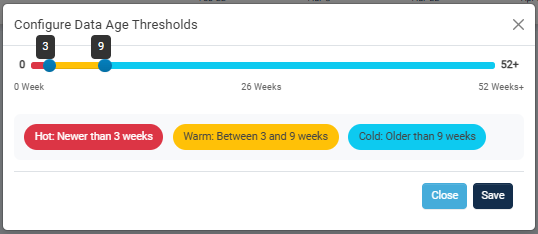
A cog icon in the upper right corner of the Legend card opens the Configure Data Age Thresholds dialog. Use the slider to set the age thresholds that define hot, warm, and cold data. Click Save to apply the new thresholds, or click Close to exit without saving. The same threshold values are used on both the Data Aging and Hot Data Analysis pages.
Data Age per Volume over Past Week
Displays a bar chart where each bar represents a volume in the PeerGFS environment. Each bar is divided into sections corresponding to the data age ranges of the items on that volume. The colors of each section match those in the Legend card.
Use the Files/Logical Size/Physical Size controls to adjust the bar chart:
- Files: When selected, each bar shows the number of files per volume in each data age range. The height of each bar segment reflects the number of files.
- Logical Size/Physical Size: When either is selected, each bar shows the size of the files per volume in each data range.
- Logical Size: The bar chart element size reflects the total size of the files if all files were fully hydrated for each data age range.
- Physical Size: The bar chart element size reflects the total size of the files in their current form for each data age range.
Use the Modified/Accessed controls to report on the number, logical size, or physical size of files that have been modified or accessed during the week.
Data Age over Past Week
Displays a pie chart representing the percentage of files in each data age range aggregated across all volumes in the PeerGFS environment.
Use the Files/Logical Size/Physical Size controls to adjust the pie chart:
- Files: When selected, each segment represents the number of files across all volumes in each data age range. Provides insight into the distribution and quantity of files across different age ranges.
- Logical Size or Physical Size: When either is selected, each segment represents the size of all files across all volumes in each data age range:
- Logical Size: Represents the total size of files as if they were fully hydrated, meaning the total size if all data were fully present and accessible. Helps in understanding the potential storage requirements if all files were in their complete form.
- Physical Size: Represents the actual size of the files in their current form on the storage system. Reflects the real storage space occupied by the files.
Use the Modified/Accessed controls to report on the percentage of files that have been modified or accessed during the week.
Historic Data Age
Displays a line graph of files for each data age range over time, aggregated across all volumes. This helps you to identify trends and hot spots in file modification and access. The colors for each section of the line graph match those for each data age range in the Legend card.
You can filter the line graph to show results from a specific date range. To do this, click the date input box at the top right of the card, select a start date in the calendar view, and then choose an end date. The graph will update to display data within this range. Additionally, the values to the left of the line graph display the percentage change of hot data for each data age range.
Use the Files/Logical Size/Physical Size controls to adjust the line graph:
- Files: When selected, the graph shows the trend of file modification or access across all volumes in each data age range. Provides insight into the distribution and quantity of files across different age ranges.
- Logical Size or Physical Size: When either is selected, each line shows the trend of all file sizes across all volumes in each data range:
- Logical Size: Represents the trend of file sizes as if all files were fully hydrated.
- Physical Size: Represents the trend of file sizes in their current form on the storage system.
Use the Modified/Accessed controls to report on the number, logical size, or physical size of files that have been modified or accessed during the week.
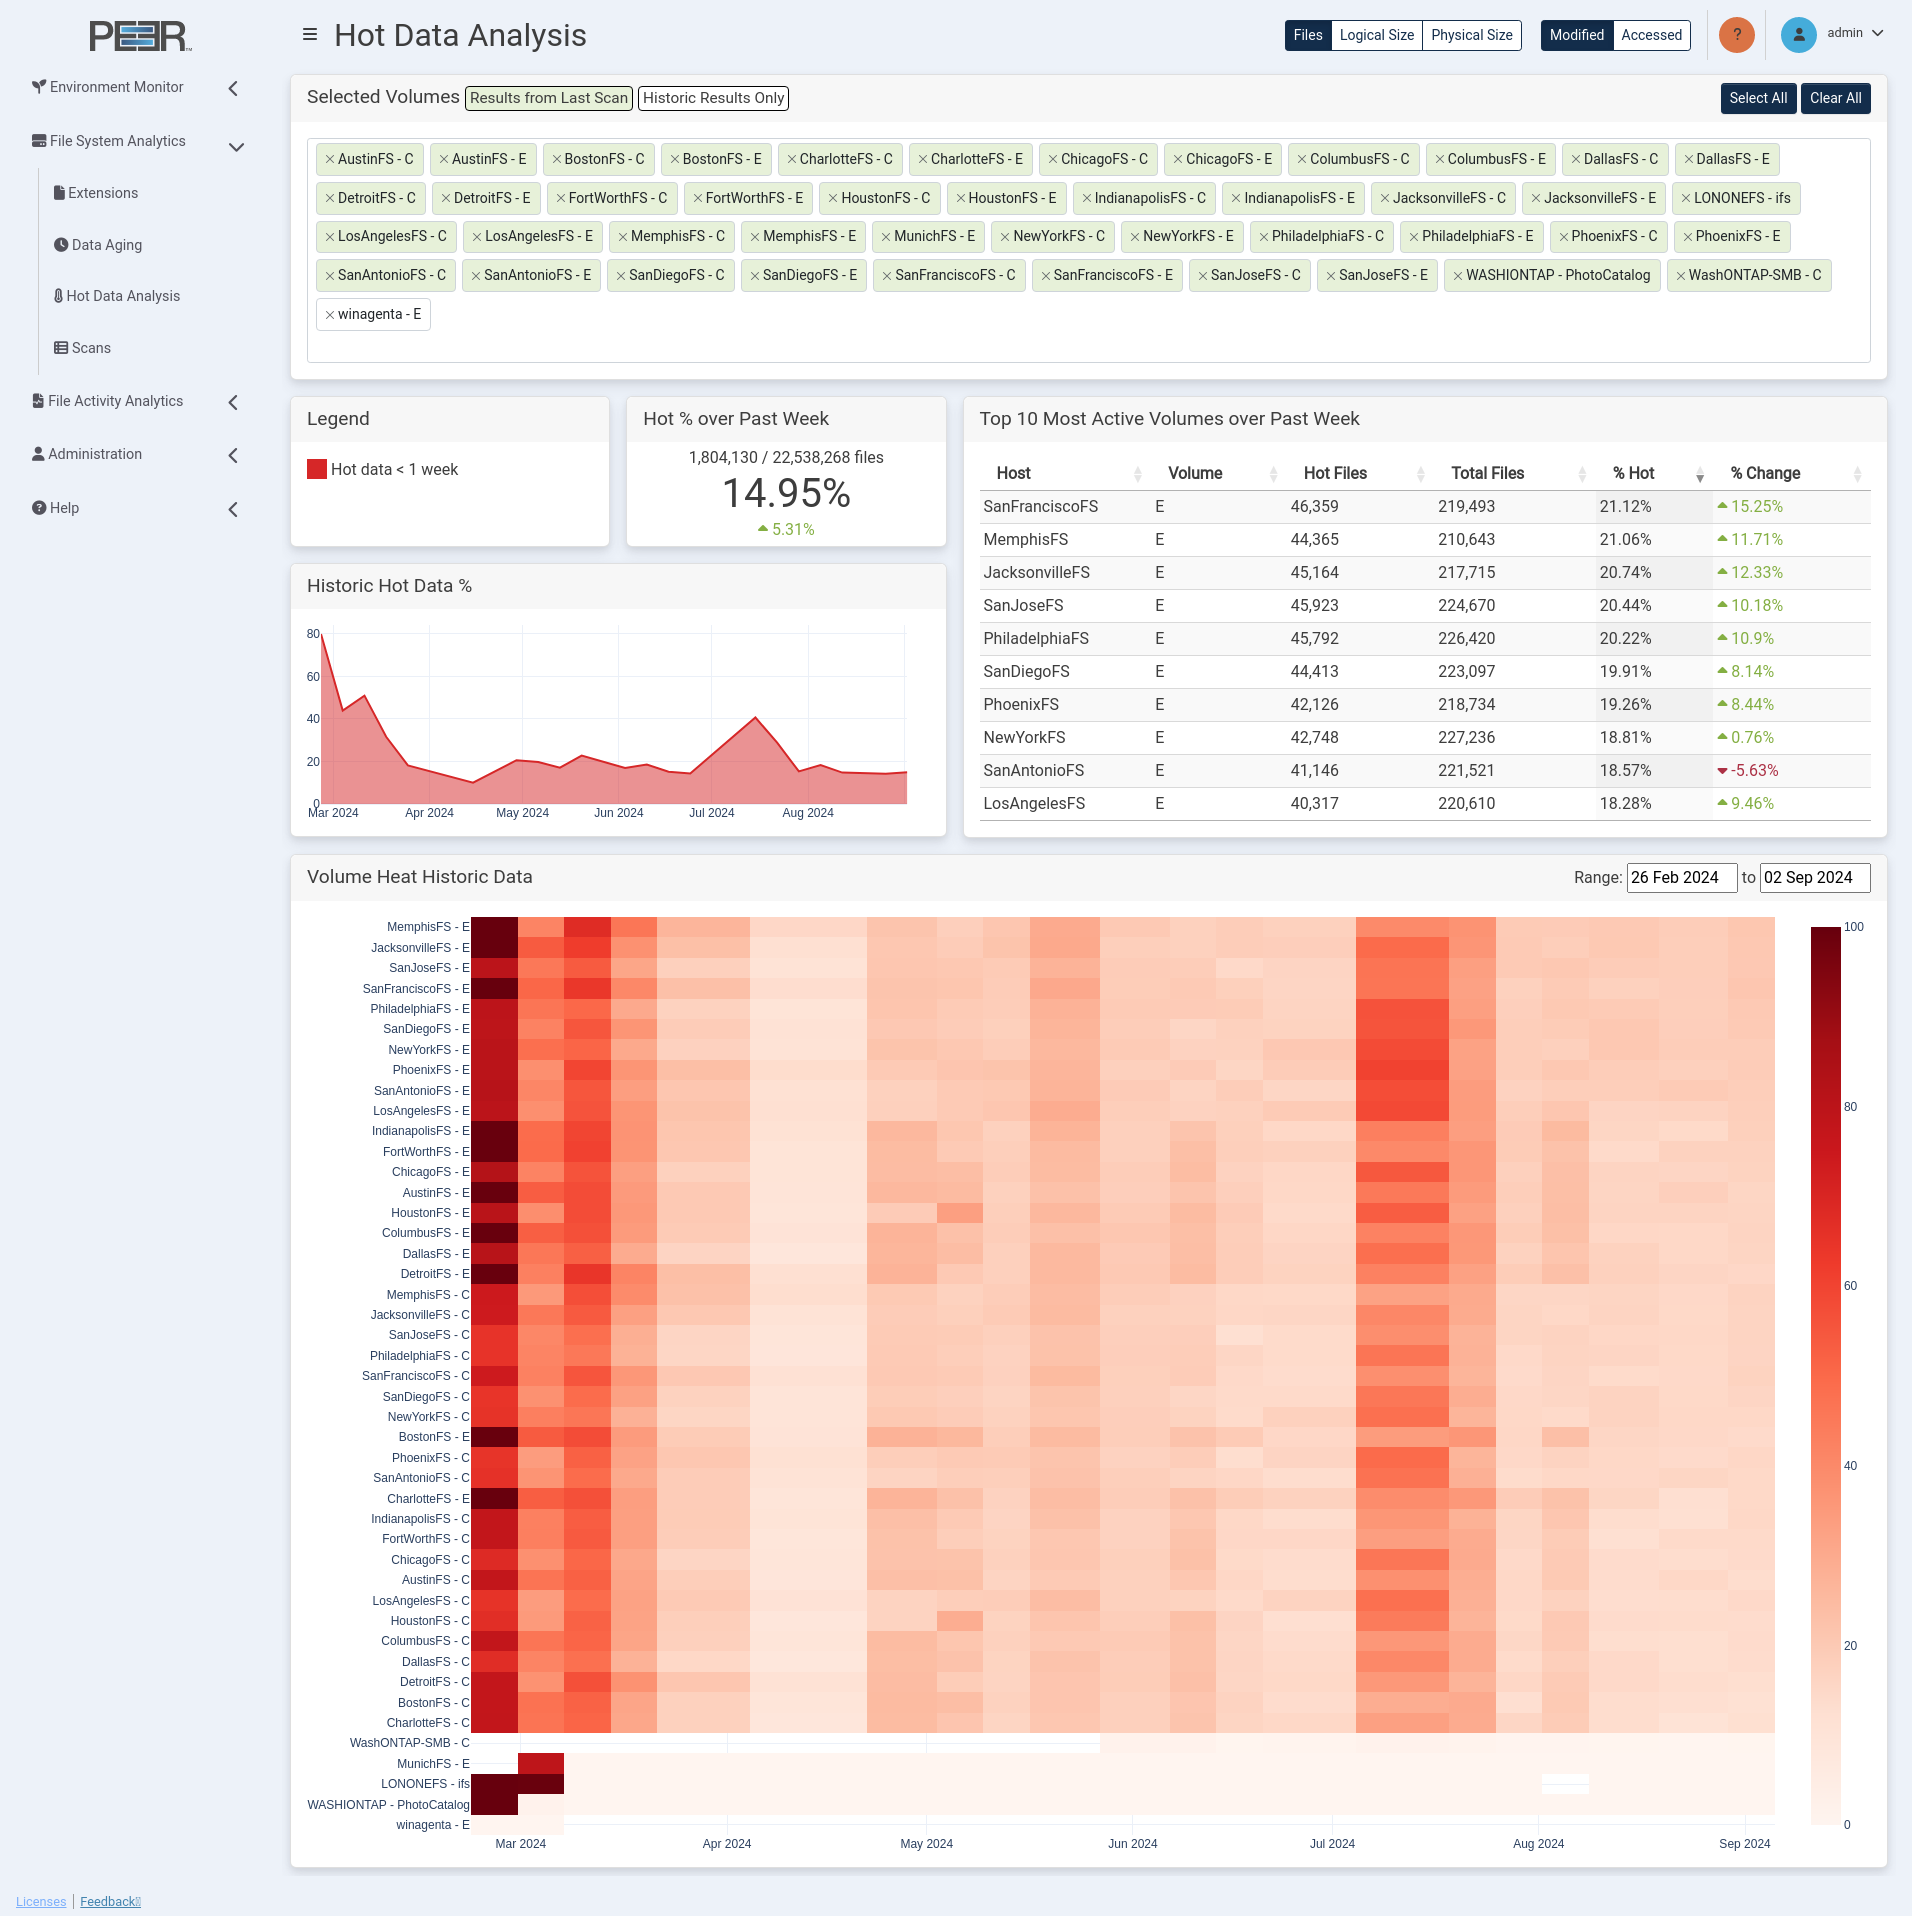
Hot Data Analysis Page
The Hot Data Analysis page provides insights into recent file activity within your PeerGFS environment. By focusing on hot data—files that have been interacted with recently—this analysis can help you identify files are currently in use or experiencing frequent changes. This information is valuable for various purposes such as resource allocation, performance optimization, and security monitoring.
Hot Data Analysis Cards
The Hot Data Analysis page contains six cards:
Selected Volumes
This card filters the volumes currently selected for analysis. Selected volumes are sorted into two categories: Results from Last Scan and Historic Results Only. Volumes with recent scans are shown in green, while volumes with no recent scans are shown in white. These white-labeled volumes do not contribute to page elements displaying current data but are included when analyzing historic trends.
Use these options to modify which volumes are selected:
- Select All: Select all available volumes.
- Clear All: Deselect all volumes.
- Individual Volume Search: Search for and add a volume by typing the name in the Selected Volumes field and selecting the appropriate volume from the drop-down list.
- Individual Volume Removal: Click the X next to a volume name to remove that specific volume.
Legend
Illustrates the color associated with the data range and specifies the corresponding data range.
A cog icon in the upper right corner of the Legend card opens the Configure Data Age Thresholds dialog. Use the slider to set the age thresholds that define hot, warm, and cold data. Click Save to apply the new thresholds, or click Close to exit without saving. The same threshold values are used on both the Data Aging and Hot Data Analysis pages.
Hot % over Past Week
Displays the percentage of files classified as hot during the current week. The colored value below indicates the percentage change compared to the previous week: green with an up arrow for an increase, and red with a down arrow for a decrease.
Use the Files/Logical Size/Physical Size controls to adjust the card:
- Files: When selected, the card shows the percentage of the number of files that are hot during the week.
- Logical Size or Physical Size: When either is selected, each shows the percentage of the size of files that are hot during the week.
- Logical Size: Shows the percentage of the size of files as if all were fully hydrated that are hot during the week.
- Physical Size: Shows the percentage of the size of files in their current form that are hot during the week.
Use the Modified/Accessed controls to report on the percentage of files that have been modified or accessed during the week.
Top 10 Most Active Volumes over Past Week
Displays a table providing a snapshot of the volumes with the highest file activity within your PeerGFS environment.
The table shows the following information for each volume:
- Host: The name of the host where the volume is stored.
- Volume: The name of the volume being analyzed.
- Hot Files: The number of files that are considered hot on a volume during the week. This column is visible when Files is selected as the control.
- Total Files: The total number of files within your environment. This column is visible when Files is selected as the control.
- Hot Size: The size of files that are considered hot on a volume during the week. This column is visible when either Logical Size or Physical Size is selected as the control, specifying the type of size being displayed.
- Total Size: The size of all files within your environment. This column is visible when Logical Size or Physical Size is selected as the control, specifying the type of size being displayed.
- % Hot: The percentage of files on the volume that are considered hot during the week.
- % Change: The percentage of overall change in the number of hot files this week compared to the previous week. The value will be green with an up arrow for an increase, and red with a down arrow for a decrease.
Use the Files/Logical Size/Physical Size controls to adjust the table:
- Files: When selected, the table shows the most active volumes based on the number of files, providing insight into file activity and distribution.
- Logical Size or Physical Size: When either is selected, the table shows the most active volumes based on the size of files.
- Logical Size: Represents the total size of files as if they were fully hydrated, meaning the total size if all data were fully present and accessible.
- Physical Size: Represents the actual size of the files in their current form on the storage system.
Use the Modified/Accessed controls to report on the percentage of file count, logical size, or physical size that has been modified or accessed during the week.
The default sorting of the table is determined by the selected control at the top of the page (Files/Logical Size/Physical Size). Click any column header to sort the table by that specific column.
Historic Hot Data %
Displays a line graph showing the percentage of hot files that have been changed over time, aggregated across all volumes in your PeerGFS environment. The graph provides insights into the trend of hot file activity over a historical period, allowing you to track changes and patterns in file usage and modification/access behavior across your system.
Use the Files/Logical Size/Physical Size controls to adjust the graph:
- Files: When selected, the graph shows the trend of the percentage of hot files over time.
- Logical Size or Physical Size: When either is selected, the graph shows the trend of the percentage of hot files based on their size.
- Logical Size: Represents the total size of files as if they were fully hydrated, meaning the total size if all data were fully present and accessible.
- Physical Size: Represents the actual size of the files in their current form on the storage system.
Use the Modified/Accessed controls to report on the percentage of files that have been modified or accessed during the week.
Volume Heat Historic Data
Displays a heatmap representing each volume in the PeerGFS environment and the percentage of files on those volumes considered hot per week. This information is valuable for identifying trends in hot data totals across all volumes, aiding in the analysis of data usage patterns and resource allocation within your environment.
The volumes selected for analysis are identified by labels to the left of the heatmap. The heatmap colors indicate different levels of intensity or frequency, with a color scale to the right of the heatmap explaining what each color represents in terms of data magnitude or intensity.
You can filter the heatmap to show results from a specific date range. To do this, click the date input box at the top right of the card, select a start date in the calendar view, and then choose an end date. The heatmap will update to display data within this range.
Use the Files/Logical Size/Physical Size controls to adjust the graph:
- Files: When selected, the heatmap shows the trend of the percentage of hot files over time.
- Logical Size or Physical Size: When either is selected, the heatmap shows the trend of the percentage of hot files based on their size.
- Logical Size: Represents the total size of files as if they were fully hydrated, meaning the total size if all data were fully present and accessible.
- Physical Size: Represents the actual size of the files in their current form on the storage system.
Use the Modified/Accessed controls to report on the percentage of files that have been modified or accessed during the week.
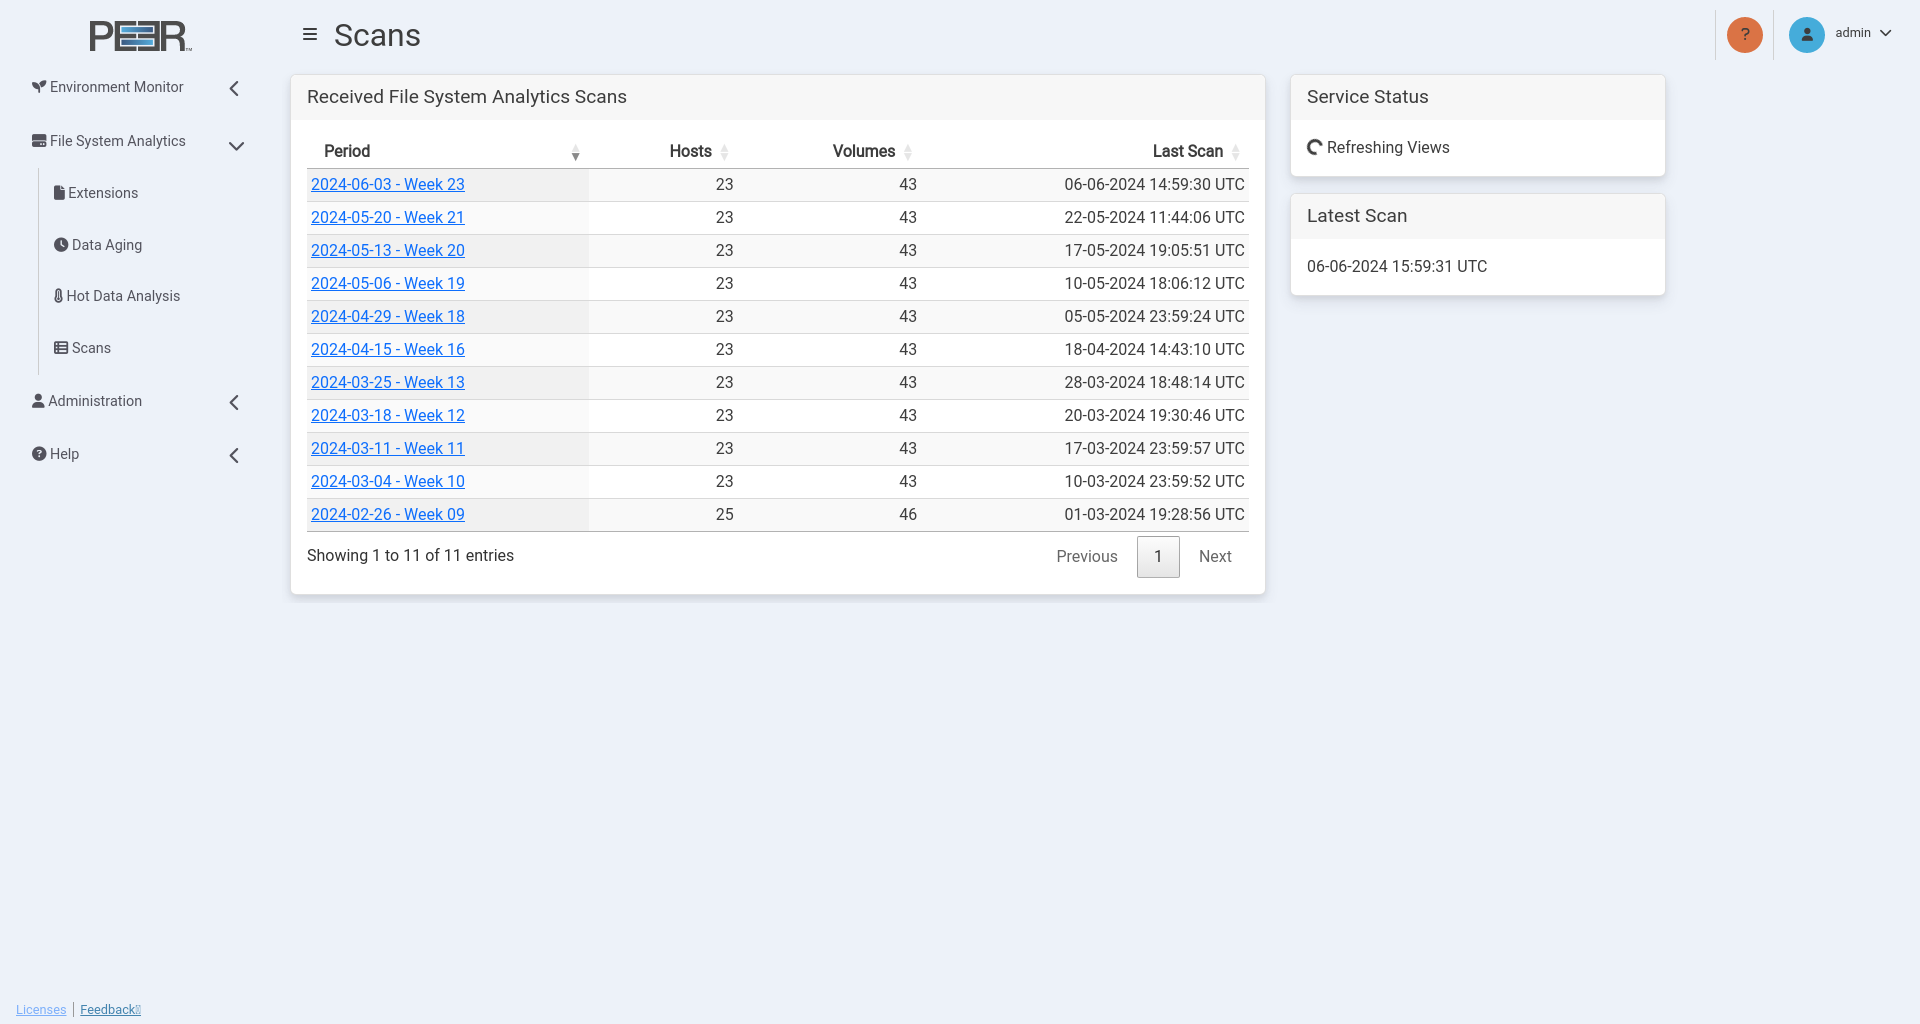
Scans Page
The Scans page provides detailed information about the File System Analytics scans received by PeerIQ from the connected PMC. It is accessible only to Administrator accounts.
Scans Page Cards
The Scans page contains three cards:
| Card | Description |
|---|---|
| Received File System Analytics Scans | Displays a table listing the last ten scans received by PeerIQ and includes the following information for each scan: • Period: The time period (in weekly increments) during which the scan occurred. • Hosts: The number of hosts that sent scan data during this period. • Volumes: The number of volumes that were scanned during this period. • Last Scan: The time and date when the last scan was received for this period. This table is sorted by scan period by default, with the most recent period at the top. Click any column header to sort the table by that column. To view more detailed information about a scan, click its date range in the Period column. |
| Service Status | Displays the current status of the scan service. The status can be: • Ingesting: Scan data is currently being ingested by PeerIQ. • Refresh Queued: A refresh of the File System Analytics pages is pending. • Refreshing Views: A refresh of the File System Analytics pages is in progress. • Idle: No File System Analytics scan data is being processed. • Errors: There is a problem with processing the scan data. |
| Latest Scan | Displays the data and time of the latest scan. |
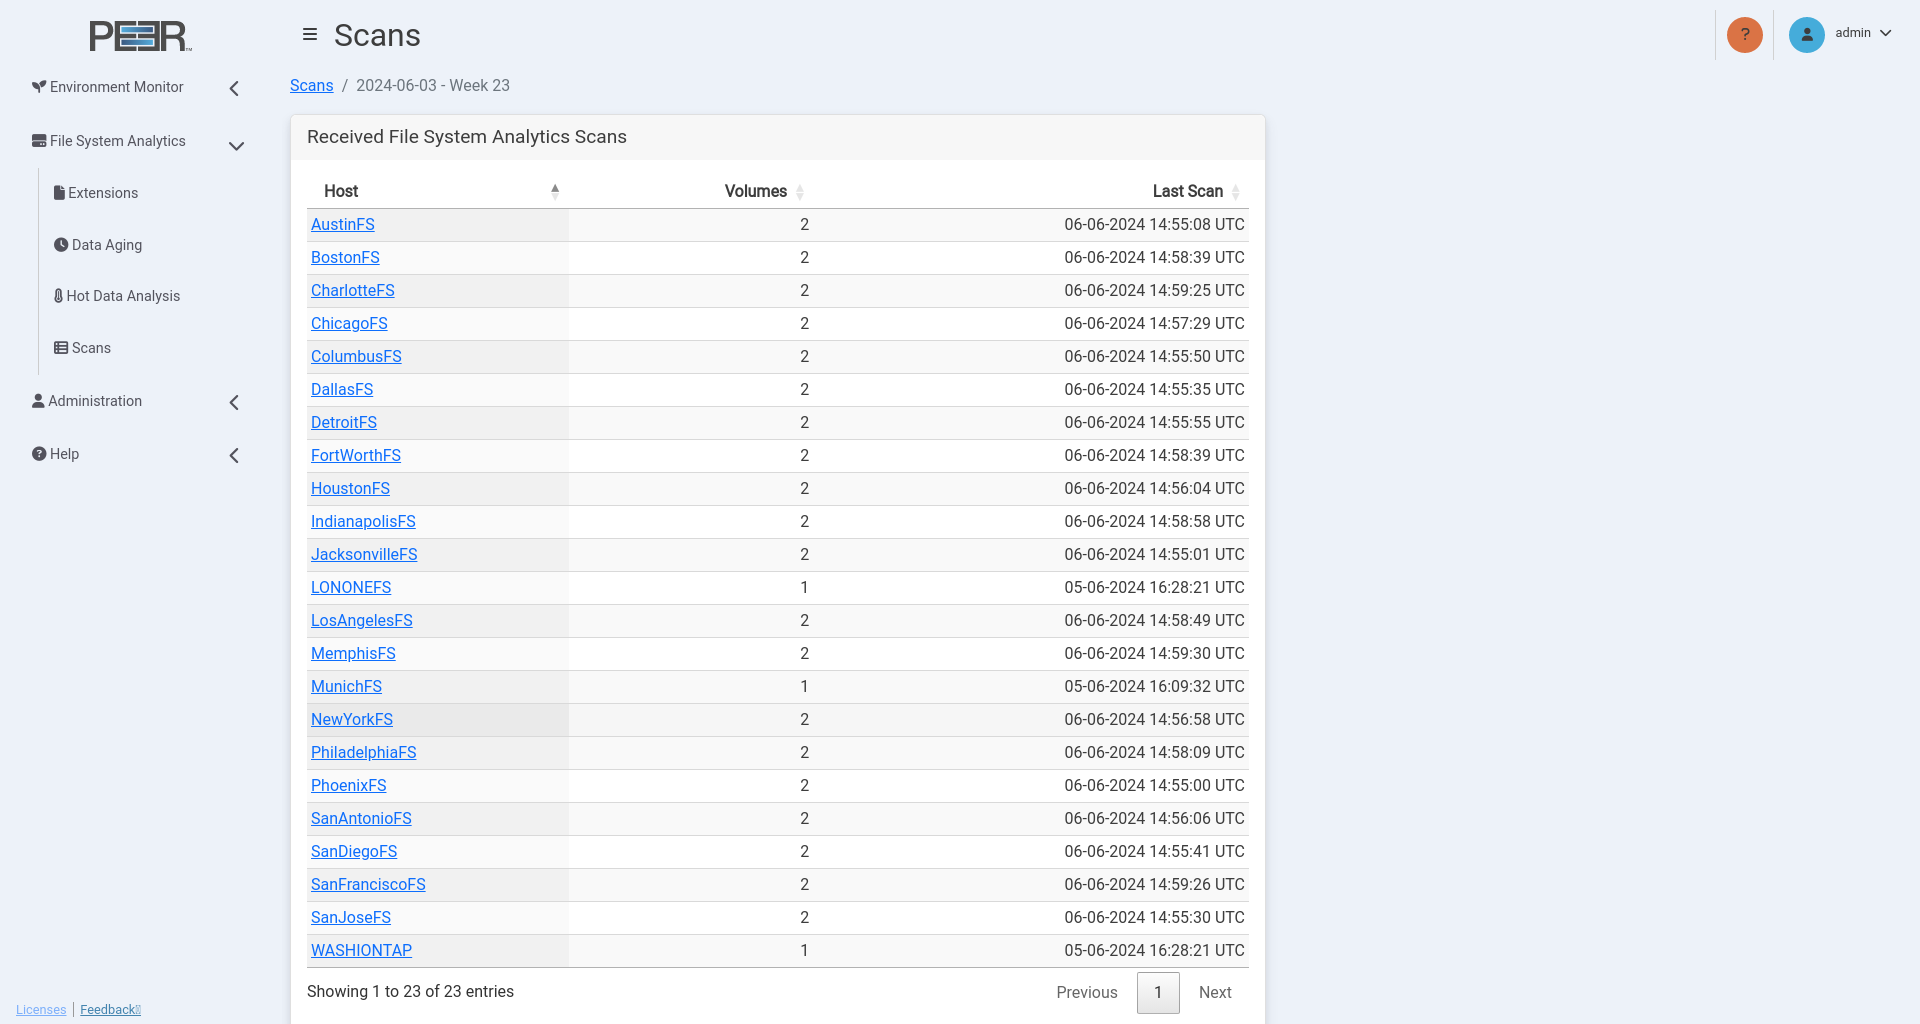
Viewing Detailed Scan Information
To view more detailed information about a scan, click its date range in the Period column. This action displays a table with additional details about the scan, including each host that participated in the scan during this period.
The table has the following columns:
| Column | Description |
|---|---|
| Host | Displays the name of the host. To view more detailed information about a host, click its name. |
| Volumes | Displays the number of volumes that were scanned during this time period. |
| Last Scan | Displays the time and date when the last scan was received for this time period. |
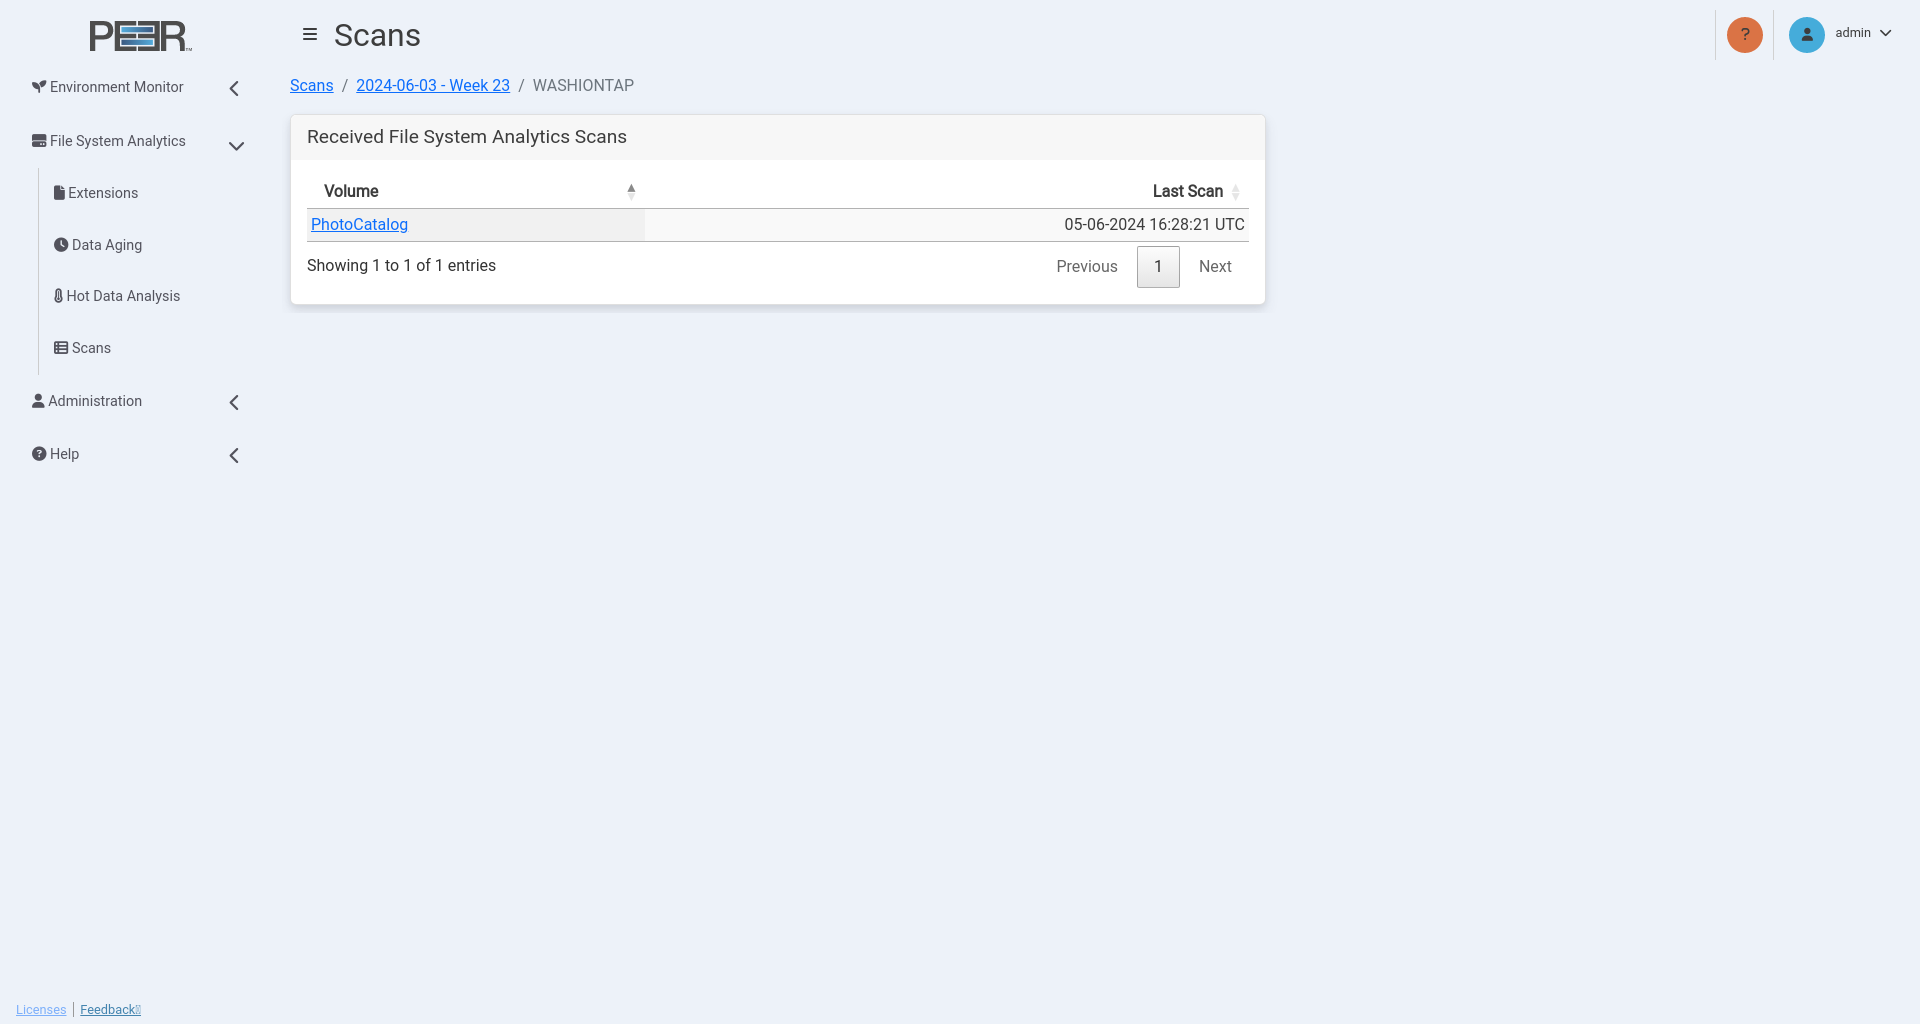
Viewing Detailed Host Information
To view more detailed information about a host, click its name in the Host column. This action displays a table with additional details about the host, including each volume associated with that host.
The table has the following columns:
| Column | Description |
|---|---|
| Volume | Displays the name of the volume. To display more detailed information about a volume, click its name. |
| Last Scan | Displays the time and date when the last scan was received for this time period. |
Viewing Detailed Volume Information
To view more detailed information about a volume, click its name in the Volume column. This action displays a page with cards that provide a detailed breakdown of scan information for that volume.
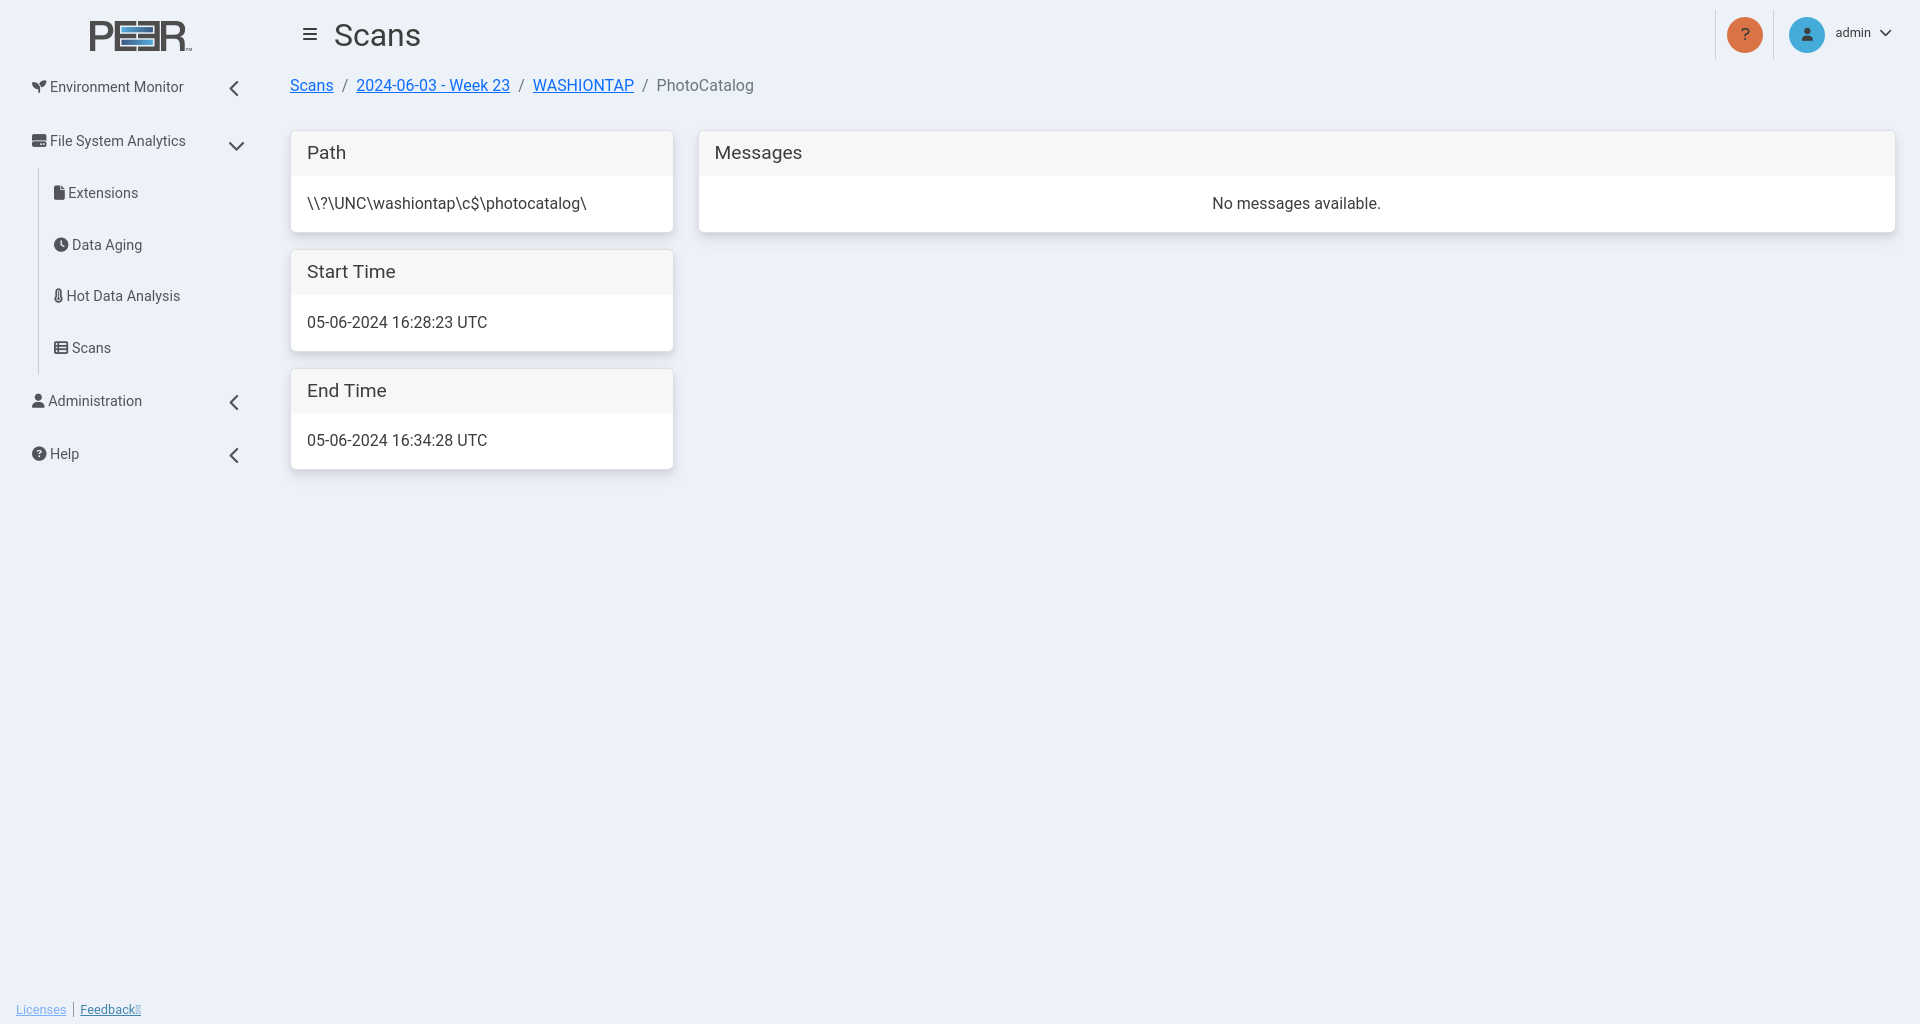
This page contains four cards:
| Card | Description |
|---|---|
| Path | Displays the path of the volume being scanned. |
| Start Time | Displays the start time of the scan for this volume. |
| End Time | Displays the end time of the scan for this volume. |
| Messages | Displays any log entries generated for this volume during the scan. |
File System Analytics Configuration
The File System Analytics Configuration page enables Administrators to manage file system data collected from PeerGFS agents. These settings control how long historical scan information is stored, when processing occurs, and how to clear all accumulated File System Analytics data when necessary.
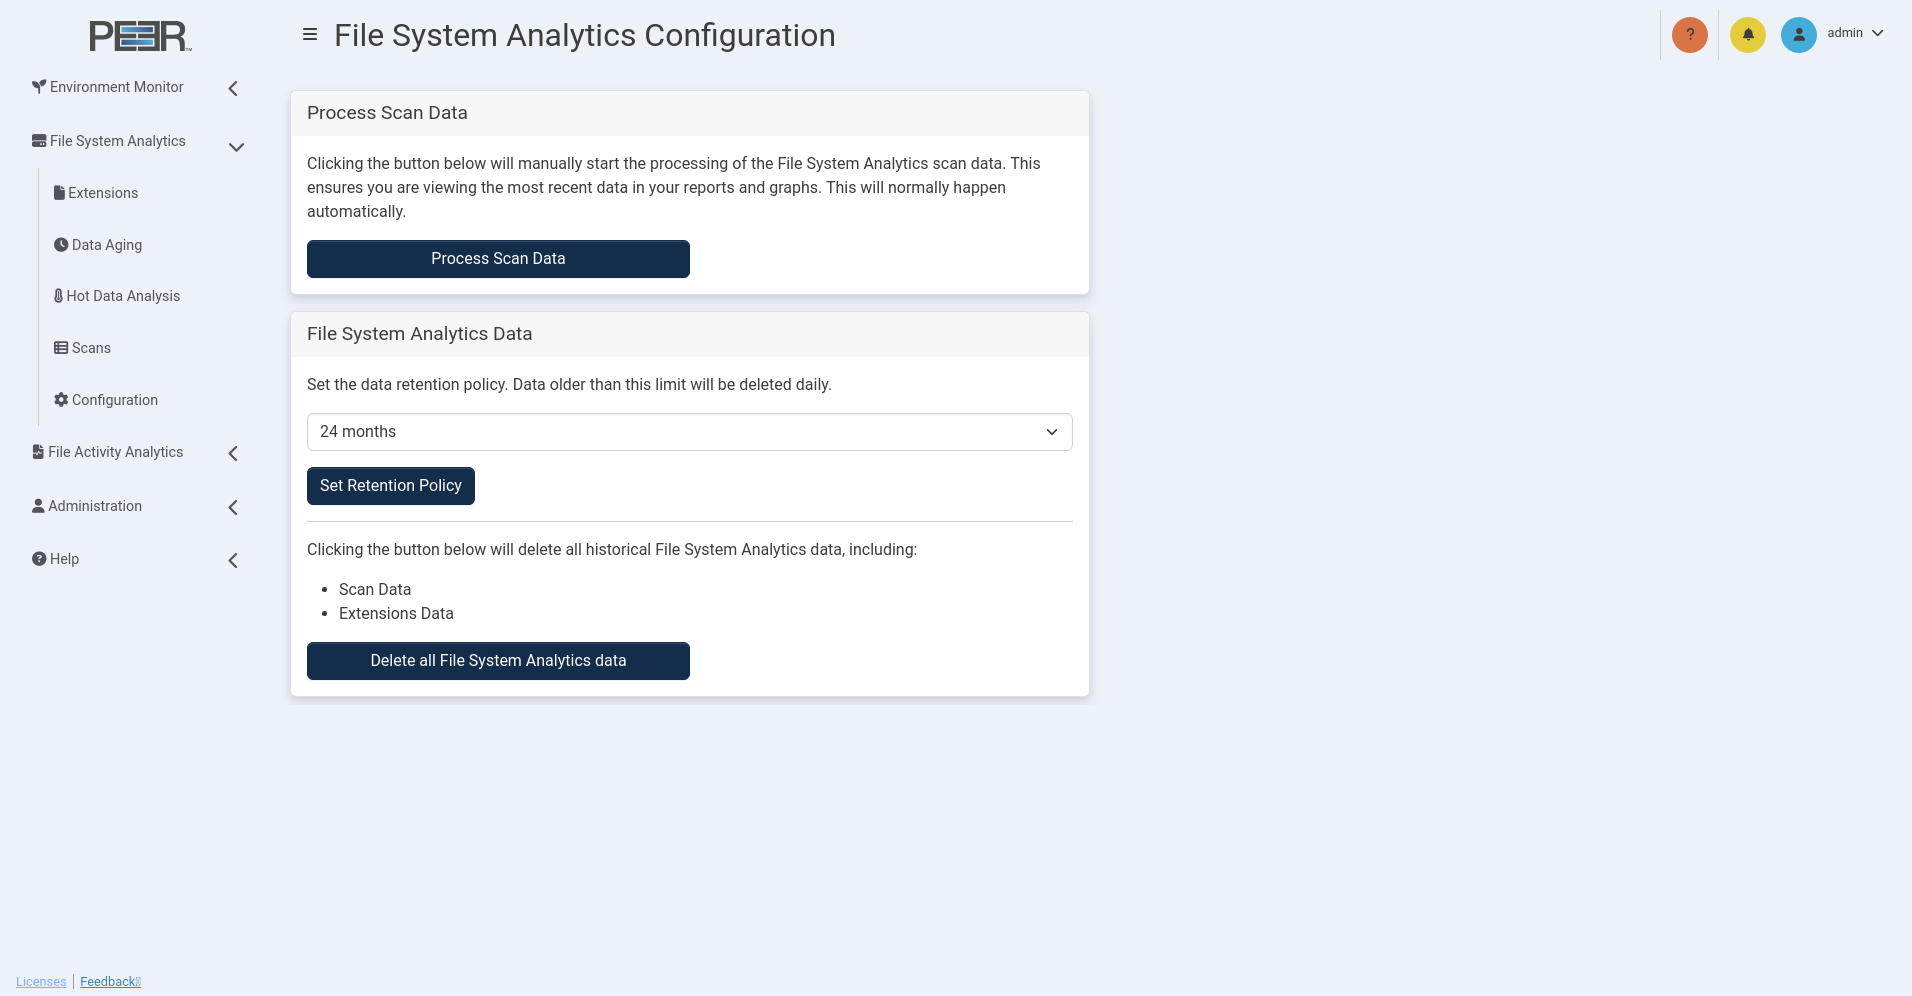
Process Scan Data
Agents in your PeerGFS environment routinely scan file system volumes associated with active jobs. This scan data is sent to PeerIQ for processing and used throughout the File System Analytics pages.
If processing is ever interrupted, click Process Scan Data to manually restart processing. This ensures that the analytics pages reflect the most recent scan data. Under normal circumstances, processing occurs automatically.
File System Analytics Data Retention
The File System Analytics Data card controls how long PeerIQ retains the processed scan data used throughout the Extensions, Data Aging, Hot Data Analysis, and Scans pages.
Use the dropdown menu to select the maximum amount of historical scan data PeerIQ should store. Options range from 1 month to 24 months. Any scan data older than the configured limit is automatically removed during daily maintenance.
After selecting a retention period, click Set Retention Policy to apply it.
Note: Reducing the retention period permanently deletes all File System Analytics data older than the new limit. Increasing the retention period does not restore previously deleted data.
You may also delete all File System Analytics data at any time by clicking Delete all File System Analytics data. This action removes all scanned analytics history, including: - Scan Data - Extensions Data
Note: This action is irreversible. Once deleted, the data cannot be recovered.