Monitoring the PeerGFS Environment
The following section describes the Environment Monitor pages. These pages provide details about your PeerGFS environment, including the PMC, Agents, and the jobs.
The seven Environment Monitor pages are:
-
Overview
-
PMC
-
Jobs
-
Agents
-
Volumes
-
Watch Set
-
License
Using the Environment Monitoring Page Controls
Environment Monitor pages can display the most recent data, historical data, or both, depending on the page. Use the controls in the upper right corner of the page or tab to adjust the displayed information.
-
Refresh: Use this on status views to select how often the most recent data refreshes. Options are off, meaning the page will not refresh automatically, or 1 minute.
-
Start: Use this on history views to select the starting date and time for the displayed data.
-
Range: Use this on history views to select how much data is displayed after the selected start point.
On pages with separate Status and History tabs, the Status tab shows the most recent data and uses the Refresh control. The History tab uses the Start and Range controls to display a selected historical time period.
On pages that combine current and historical information, the current summary cards show the most recent data, while the historical graphs use the Start and Range controls.

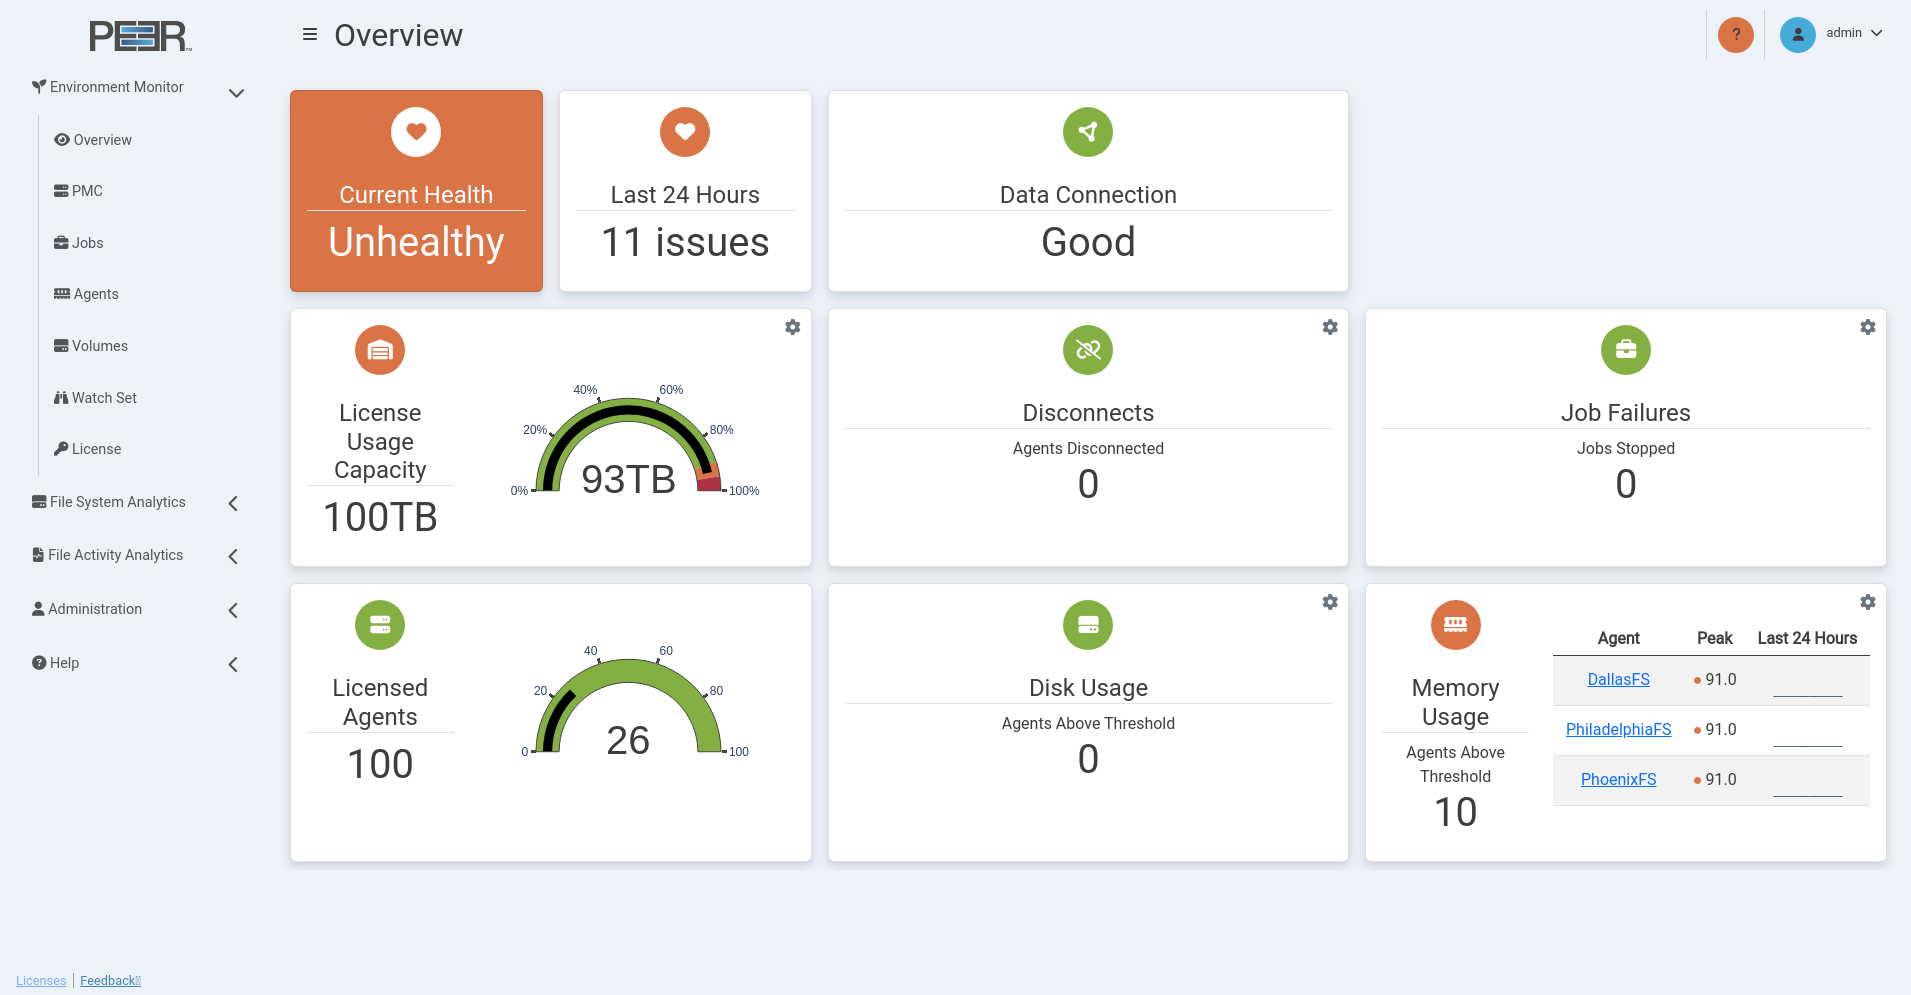
Overview Page
The Overview page is a dashboard displaying the critical aspects of the PeerGFS environment. Each card represents a specific area of health, providing an at-a-glance view of issues from the last 24 hours. The color and status indicator on each card reflects the current health based on detected issues.
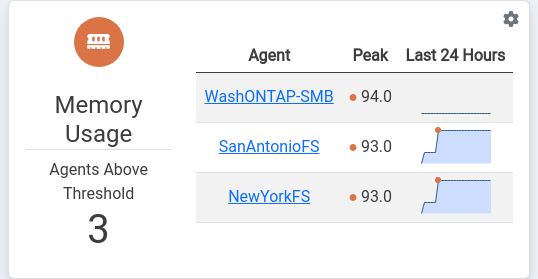
When there is an issue, a card displays up to three graphs depicting instances where problems have been encountered. For example, the card below shows memory usage exceeded thresholds on one Agent server. Hover over values to see when the issue occurred. Click the name of an Agent or job for more details.
Overview Page Cards
The Overview page contains nine cards:
Current Health
Visually represents the current health of the PeerGFS environment. The presence of an ongoing issue determines the status. The background color and indicator reflect this status:
- Green: Everything is functioning normally; no current issues are detected. Other cards may show different colors, indicating that thresholds were exceeded in the last 24 hours but are now within the allowed limits.
- Orange: Indicates that a Warning threshold was exceeded and remains so. The card reflects an Unhealthy state.
- Red: Indicates that a Danger threshold was exceeded and the issue is ongoing. The card reflects an Unhealthy state. Exceeding a Danger threshold overrides any warning messages.
Last 24 Hours
Visually represents the overall health of the PeerGFS environment over the last 24 hours. If all other cards show zero issues, the card indicator will be green, reflecting a Healthy status. If any card shows issues, the overall status will turn orange or red, depending on the severity:
- If any card has an orange indicator, the Last 24 Hours status is Warning, reflecting an unhealthy environment.
- If any card has a red indicator, or if multiple cards have orange indicators and at least one is red, the Last 24 Hours status is Danger, reflecting an unhealthy environment.
Data Connection
Displays the results of monitoring environment data reception from PeerGFS, excluding scan and real-time data.
A Warning (orange) status is triggered after five minutes of no data, while a Danger (red) status occurs after 30 minutes. The label shows the duration since the last data was received.
The status reflects that data reception may still be hindered even with an operational broker link. For example, this can occur if the Enable the sending of analytics data to PeerIQ checkbox was not selected during PMC configuration or if an outdated version of PeerGFS is in use.
License Usage Capacity
Displays the total capacity of the license in terabytes (TB), while the number below the gauge shows the used capacity in TB. The gauge indicates the percentage of the PeerGFS usage allowance that has been utilized. The default thresholds are:
- Danger: Exceeds 95% usage.
- Warning: Exceeds 90% usage.
Disconnects
Displays the number of Agents that have been disconnected and identifies those specific Agents. The default thresholds are:
- Danger: Exceeds 10 disconnects in a one-hour period.
- Warning: Exceeds 1 disconnect in a one-hour period.
Job Failures
Displays the number of jobs that have failed. The default thresholds are:
- Danger: Exceeds 10 disconnects in a one-hour period.
- Warning: Exceeds 1 disconnect in a one-hour period.
Licensed Agents
Displays the number of active Agents in relation to the total number of licensed Agents. The number below the Licensed Agents label shows the total number of Agents authorized by the PeerGFS license, while the number below the gauge indicates the number of Agents currently in use.
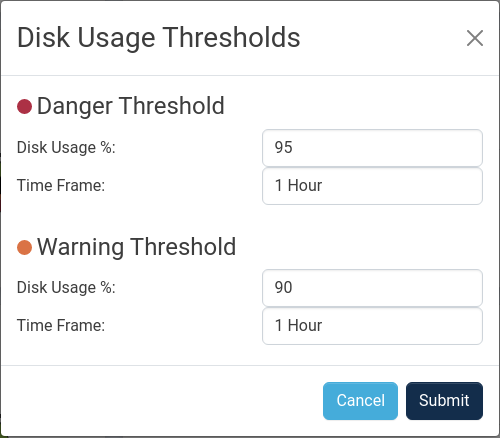
Disk Usage
Displays the number of Agents that might be utilizing a significant amount of their disk storage. The default thresholds are:
- Danger: Exceeds 95% usage in a one-hour period.
- Warning: Exceeds 90% usage in a one-hour period.
Memory Usage
Displays the number of Agents that may have experienced prolonged periods of high memory usage. The default thresholds are:
- Danger: Exceeds 95% usage in a one-hour period.
- Warning: Exceeds 90% usage in a one-hour period.
Modifying Thresholds
Preconfigured defaults for the Danger and Warning thresholds can be modified by Administrators. Using your Administrator account, click the gear icon in the upper right corner of a card to modify its thresholds. In the dialog that appears, set the Danger and Warning thresholds:
PMC Page
The PMC page provides an overview of the PMC environment. The page is organized into two tabs: Status and History.
PMC Information
The Status tab displays the most recent data received from the PMC and provides an at-a-glance view of the current environment. The History tab displays historical trends for the selected start date, start time, and range.
PMC Status
The Status tab contains six cards.
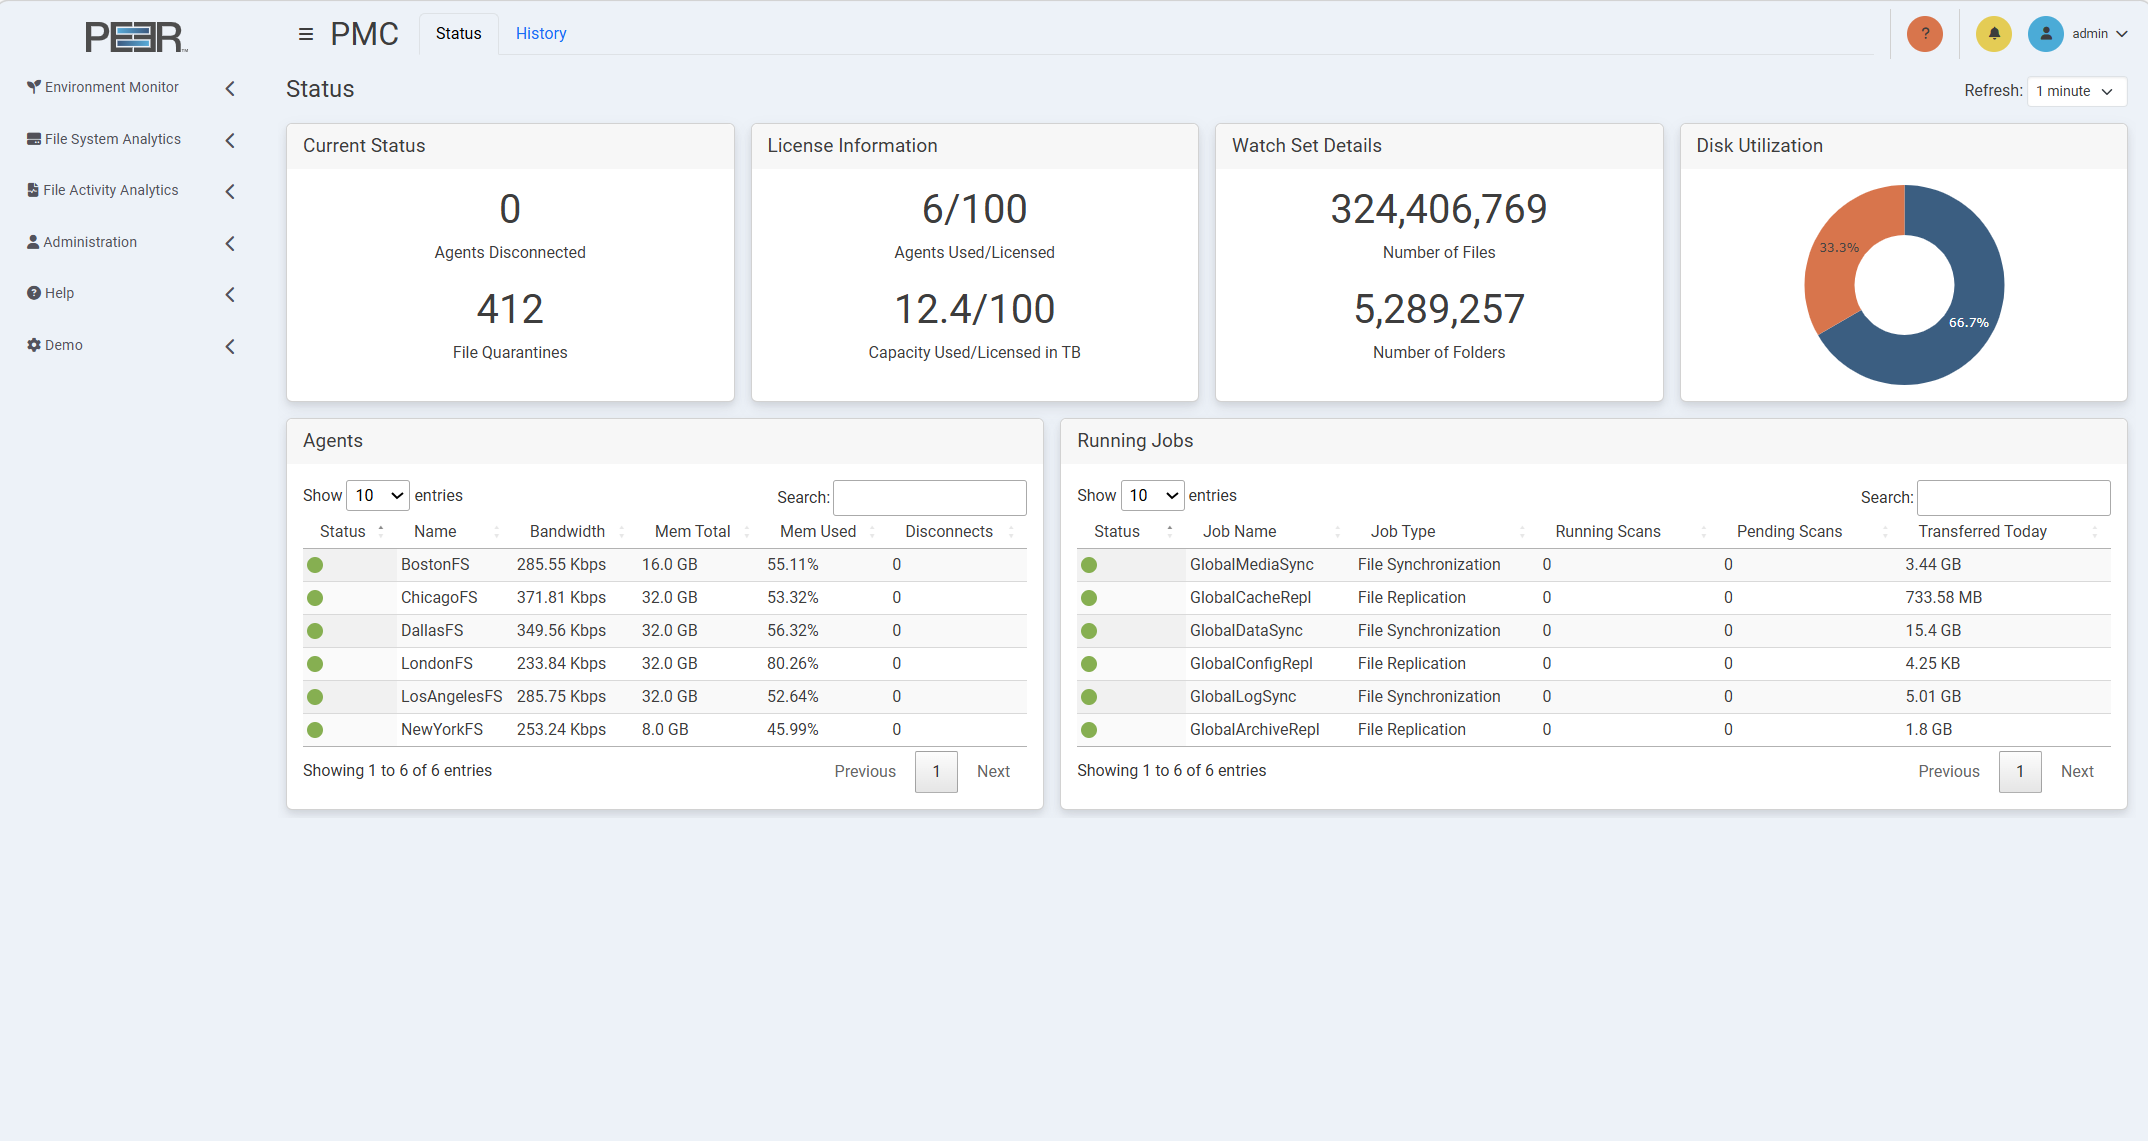
Current Status
Displays the current state of the PMC environment:
- Agents Disconnected: The total number of disconnected Agents that the PMC is aware of.
- File Quarantines: The total number of files in quarantine.
License Information
Displays current license usage:
- Agents Used/Licensed: The total number of Agents in relation to the maximum allowed by your license. Agents are counted only if they are associated with at least one job.
- Capacity Used/Licensed in TB: The total capacity used in the environment compared to the maximum licensed capacity.
Watch Set Details
Displays the current size of the PMC watch set:
- Number of Files: The total number of files in the environment.
- Number of Folders: The total number of folders in the environment.
Disk Utilization
Displays a pie chart that compares the total disk space used in the PeerGFS environment, represented in orange, with the available disk space, represented in blue.
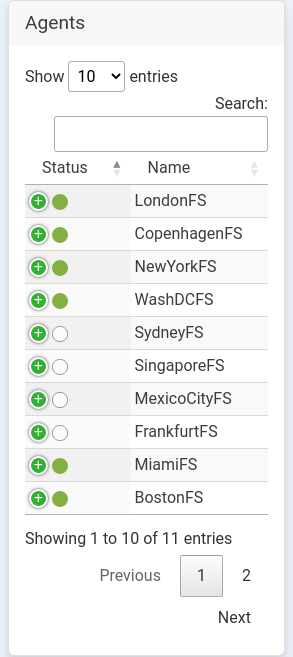
Agents
Displays a table listing all Agents in the environment, with each row representing an Agent. For more detailed information about Agents, view the Agents page.
The table shows the following information for each Agent:
-
Status: The status of the Agent is indicated by color:
- Green: Connected
- Yellow: Pending
- Orange: Disconnected
- Black: Disabled
- White: Unknown
-
Name: The name of the Agent.
-
Bandwidth: The tested bandwidth between the PMC and the Agent. You must first run Test Agent Bandwidth Speed in the Agents view in the PMC for a value to be displayed.
-
Mem Total: The total memory available to the Agent.
-
Mem Used: The percentage of the total memory currently in use.
-
Disconnects: The number of disconnects for this Agent.
Use the Show entries control to choose how many Agents are displayed. Use Search to filter the table.
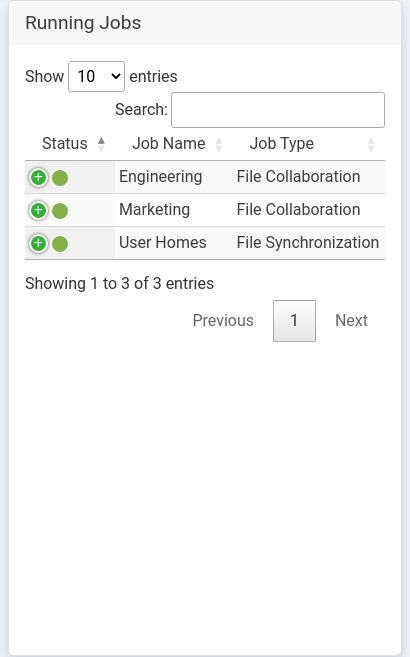
Running Jobs
Displays a table listing all currently running jobs in the environment, with each row representing a job. For more detailed information about all jobs, including jobs that are not running, view the Jobs page.
The table shows the following information for each job:
-
Status: The status of the job is indicated by color:
- Green: Job is running
- Orange: Job is not running due to an error
- White: Job is stopped or has unknown status
-
Job Name: The name of the job.
-
Job Type: The type of job.
-
Running Scans: The total number of currently running scans.
-
Pending Scans: The total number of currently pending scans.
-
Transferred Today: The total number of bytes transferred today.
Use the Show entries control to choose how many jobs are displayed. Use Search to filter the table.
PMC History
The History tab displays historical PMC data for the selected time period. Use the Start controls to select the date and time where the history should begin. Use the Range control to select how much data is displayed after the selected start point.
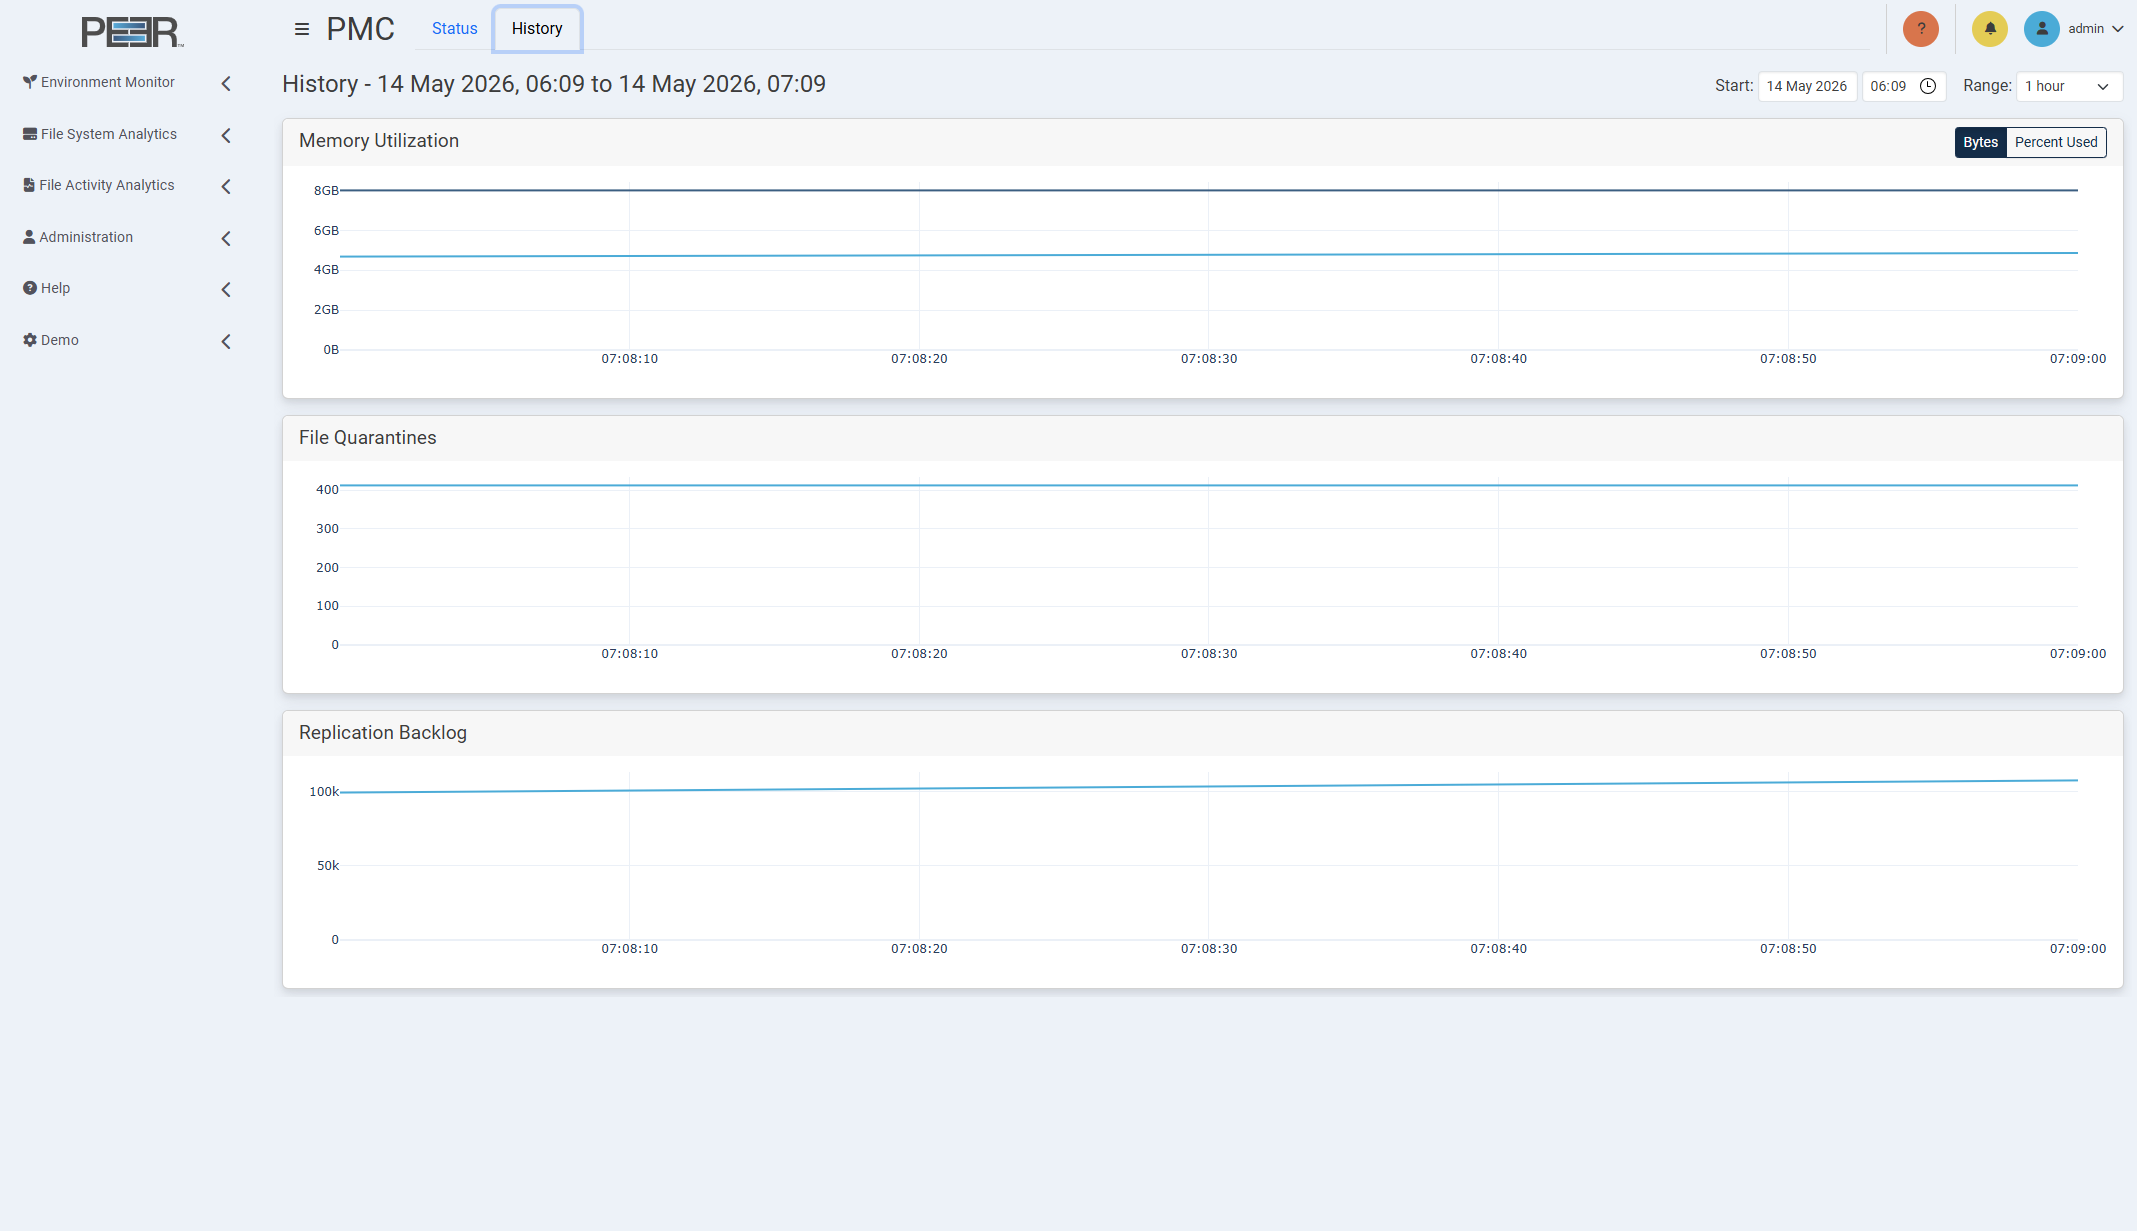
The History tab contains three cards.
Memory Utilization
Displays a line graph that shows the system memory usage of the PMC server over time. Use the Bytes and Percent Used controls to change how memory usage is displayed.
File Quarantines
Displays a line graph that shows the total number of files in quarantine over time.
Replication Backlog
Displays a line graph that shows the total number of files in the replication backlog over time.
Jobs Page
The Jobs page provides detailed information about PeerGFS jobs in the environment.
Jobs Information
The page is organized into two tabs: Status and History.
The Status tab displays the most recent data received for the jobs in the environment. The History tab displays job trends for the selected start point and range.
Jobs Status
The Status tab contains four cards.
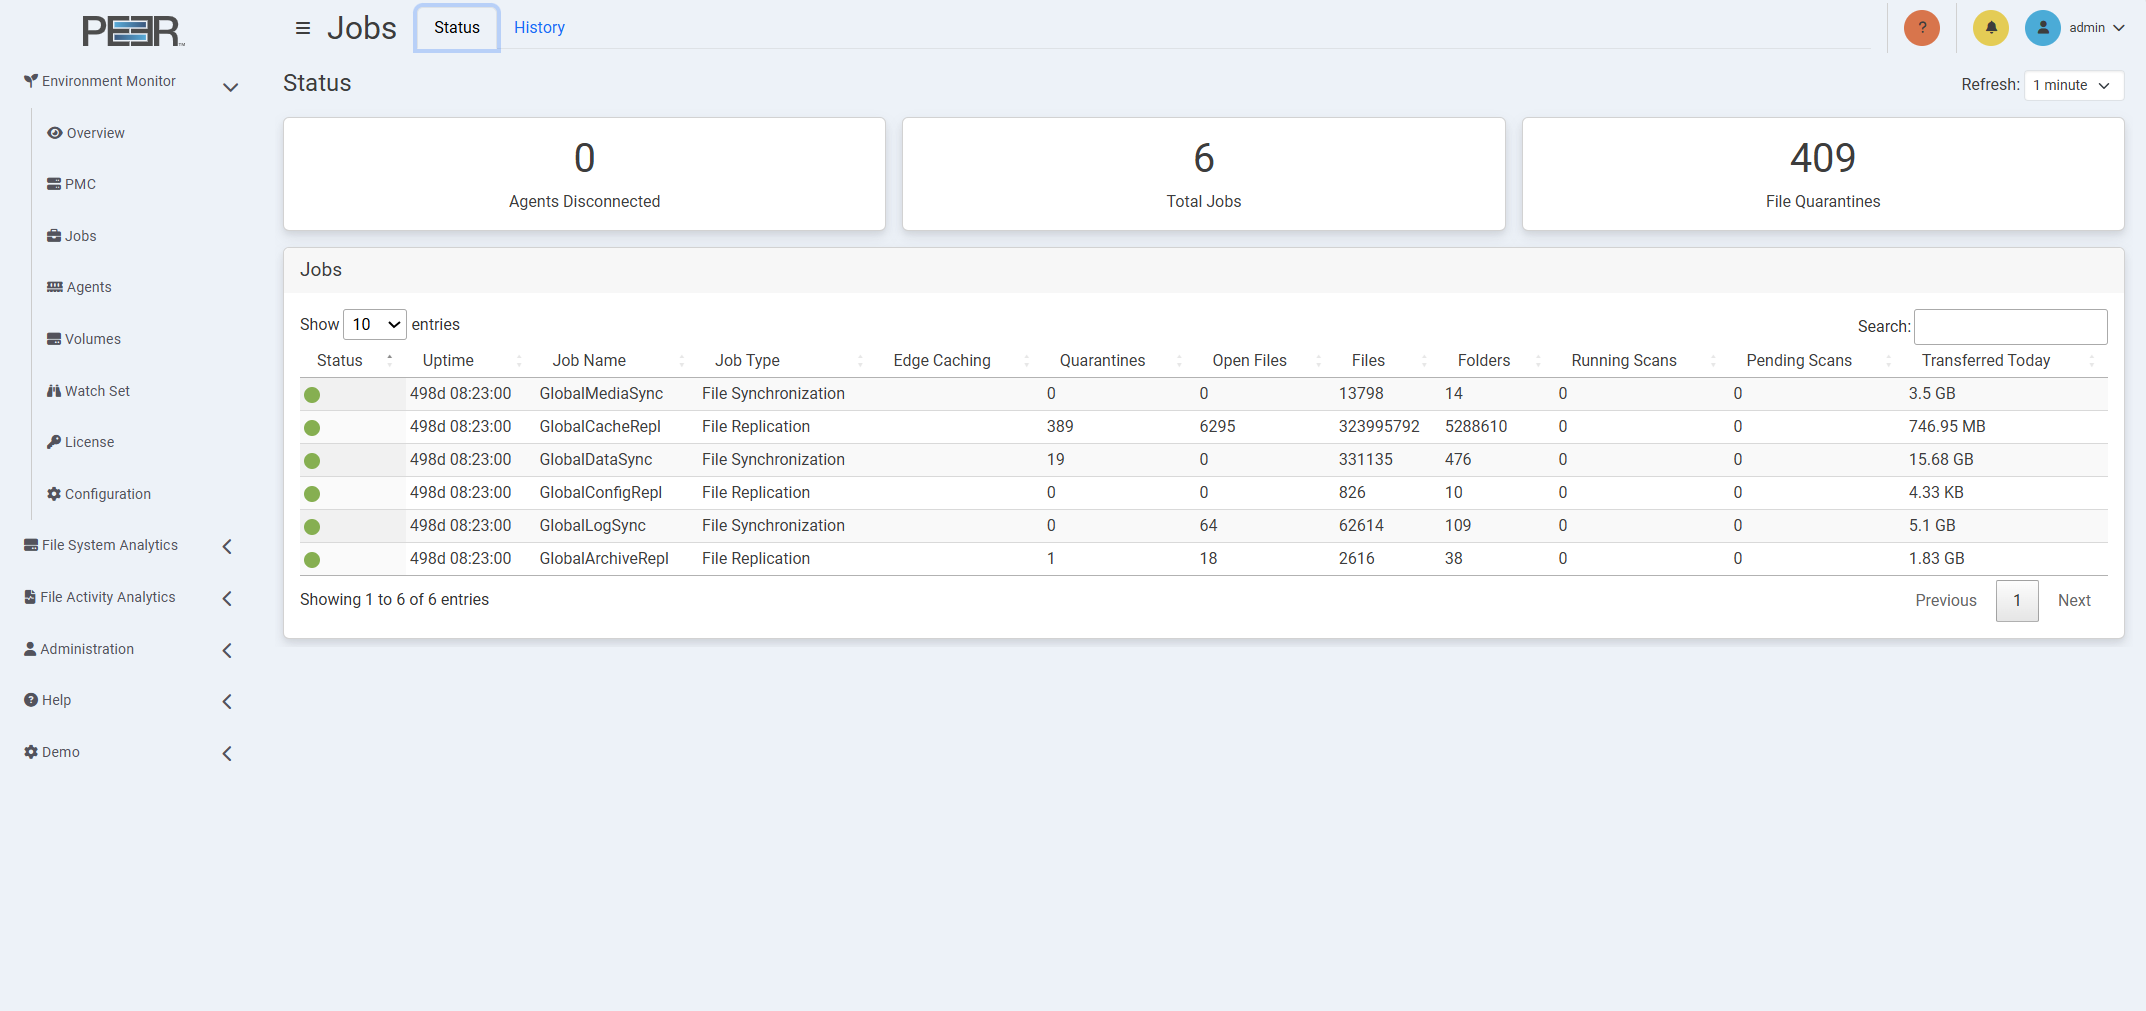
Agents Disconnected
Displays the total number of disconnected Agents in the environment.
Total Jobs
Displays the total number of jobs in the environment.
File Quarantines
Displays the total number of files currently quarantined.
Jobs
Displays a table listing all jobs in the environment, with each row representing a job.
The table displays the following information for each job:
-
Status: The color indicates the status of the job:
- Green: Running
- Orange: Any halted state
- White: Stopped or unknown
-
Uptime: The total uptime of the job.
-
Job Name: The name of the job.
-
Job Type: The type of job.
-
Edge Caching: Displays a tick when Edge Caching is enabled for this job.
-
Quarantines: The total number of files in quarantine for the job.
-
Open Files: The total number of open files for the job.
-
Files: The total number of files in the job's watch set.
-
Folders: The total number of folders in the job's watch set.
-
Running Scans: The total number of currently running scans.
-
Pending Scans: The total number of currently pending scans.
-
Transferred Today: The total number of bytes transferred today.
Use the Show entries control to choose how many jobs are displayed. Use Search to filter the table.
Jobs History
The History tab displays historical job data for the selected time period. Use the Start controls to select the date and time where the history should begin. Use the Range control to select how much data is displayed after the selected start point.
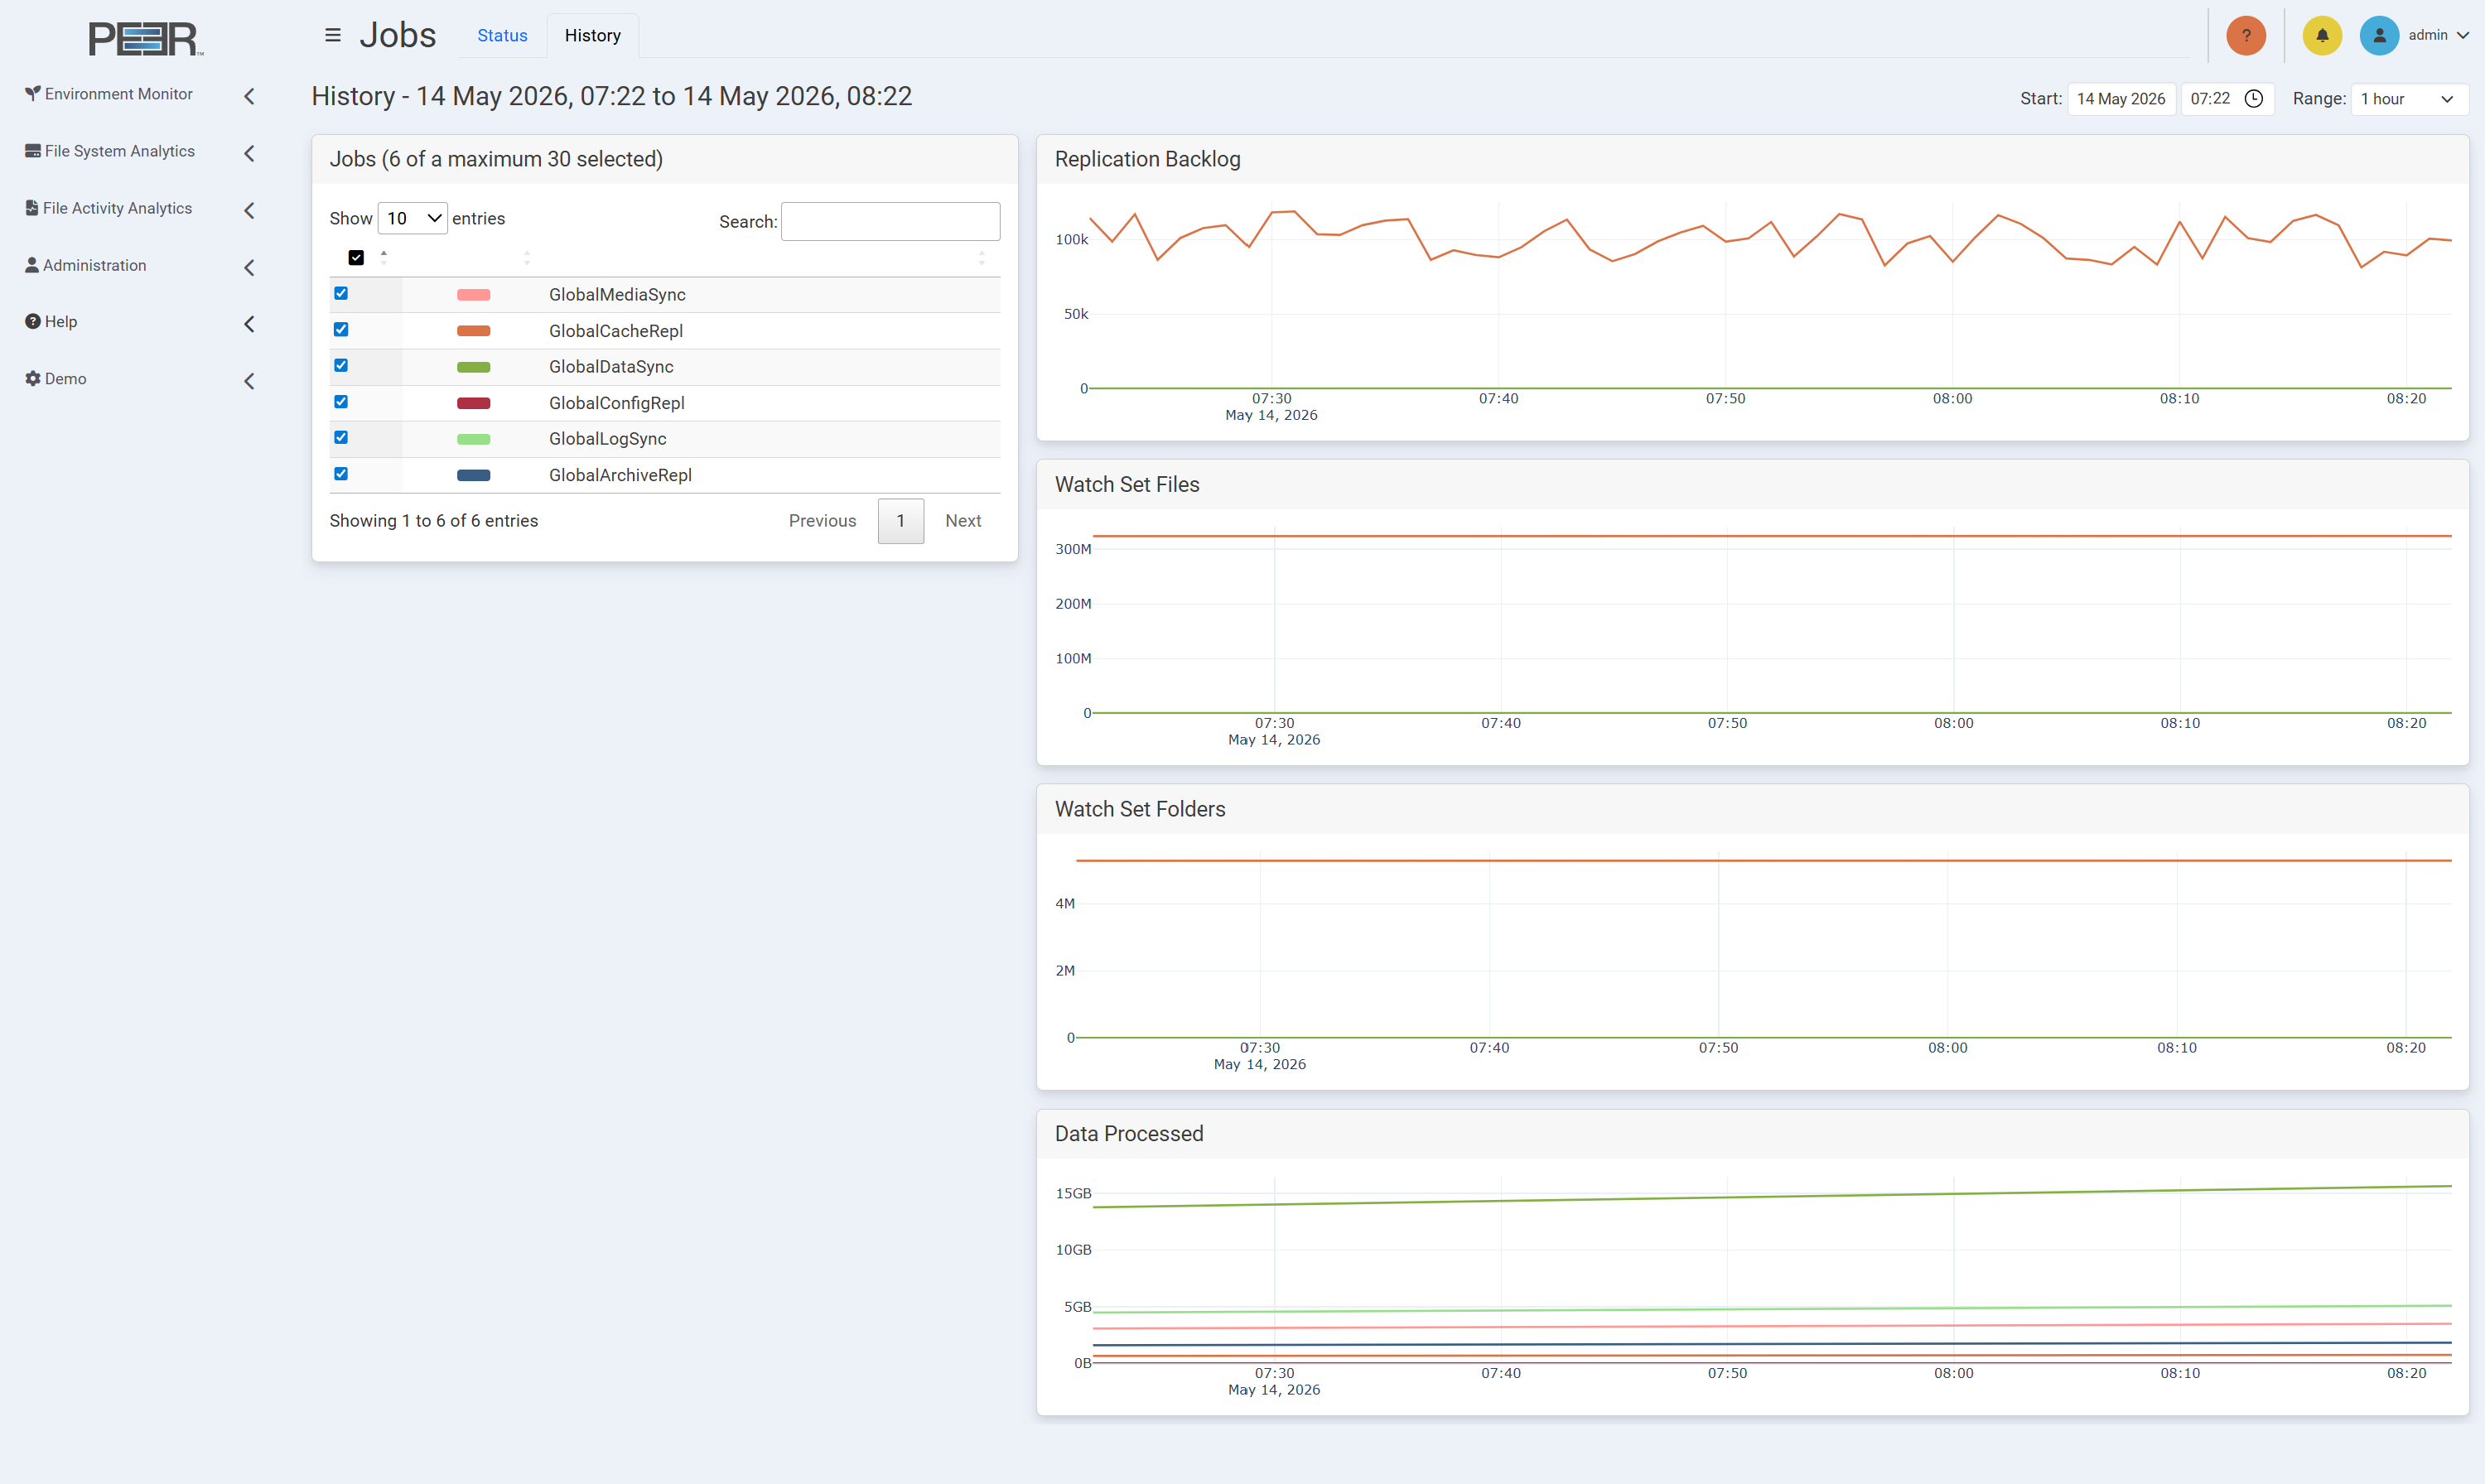
The History tab contains five cards.
Jobs
Displays a table listing the jobs included in the history graphs. The table shows each selected job and the color used to identify that job in the graphs.
Toggle the checkbox in the first column to show or hide the graph line representing that job in all graphs on the page. A maximum of 30 jobs can be selected at one time.
Use the Show entries control to choose how many jobs are displayed. Use Search to filter the table.
Replication Backlog
Displays a line graph that shows the total number of files in the replication backlog over time for the selected jobs.
Watch Set Files
Displays a line graph that shows the total number of files in the watch set over time for the selected jobs.
Watch Set Folders
Displays a line graph that shows the total number of folders in the watch set over time for the selected jobs.
Data Processed
Displays a line graph that shows the data processed in bytes over time for the selected jobs. The total resets every day.
Agents Page
The Agents page provides an overview of the Agents in the environment.
Agents Information
The page is organized into two tabs: Status and History.
The Status tab displays the most recent data received for Agents in the environment. The History tab displays Agent trends for the selected start point and range.
Agents Status
The Status tab contains four cards.
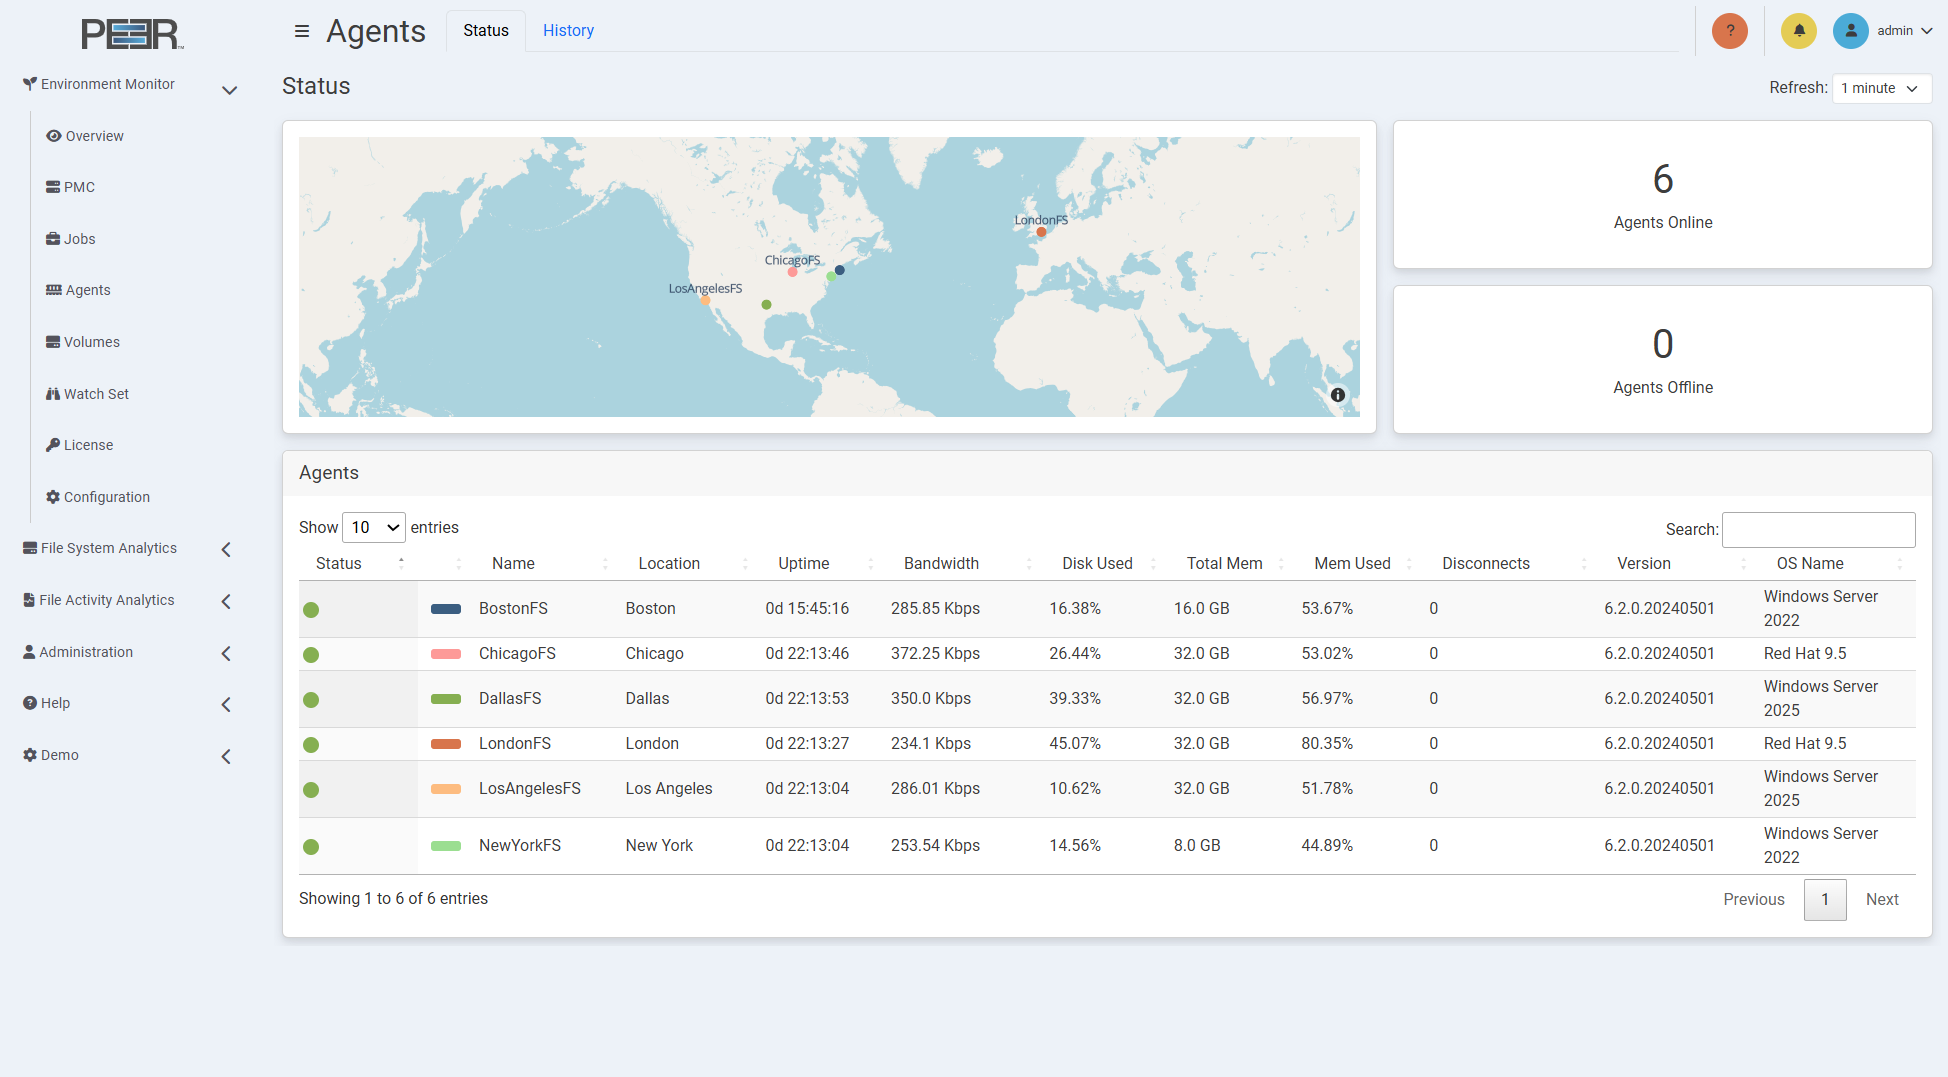
Map
Displays a world map that shows the location of all Agents in the environment. An Agent's latitude and longitude must be configured in the PMC to accurately show its location. If they are not configured, this card is not displayed.
Agents Online
Displays the total number of online Agents in the environment.
Agents Offline
Displays the total number of offline Agents in the environment.
Agents
Displays a table listing all Agents in the environment, with each row representing an Agent.
The table shows the following information for each Agent:
-
Status: The color indicates the status of the Agent:
- Green: Connected
- Yellow: Pending
- Orange: Disconnected
- Black: Disabled
- White: Unknown
-
Color: The color used to identify the corresponding Agent in history graphs and on the map.
-
Name: The name of the Agent.
-
Location: The name of the Agent's location. A location must be configured in the PMC for the location to be displayed.
-
Uptime: The current uptime of the Agent.
-
Bandwidth: The tested bandwidth between the PMC and the Agent. You must first run Test Agent Bandwidth Speed in the Agents view in the PMC for a value to be displayed.
-
Disk Used: The percentage of the total disk space currently in use.
-
Total Mem: The total memory available to the Agent.
-
Mem Used: The percentage of the total memory currently in use.
-
Disconnects: The number of disconnects for this Agent.
-
Version: The Agent's current version number.
-
OS Name: The operating system the Agent is running on.
Use the Show entries control to choose how many Agents are displayed. Use Search to filter the table.
Agents History
The History tab displays historical Agent data for the selected time period. Use the Start controls to select the date and time where the history should begin. Use the Range control to select how much data is displayed after the selected start point.
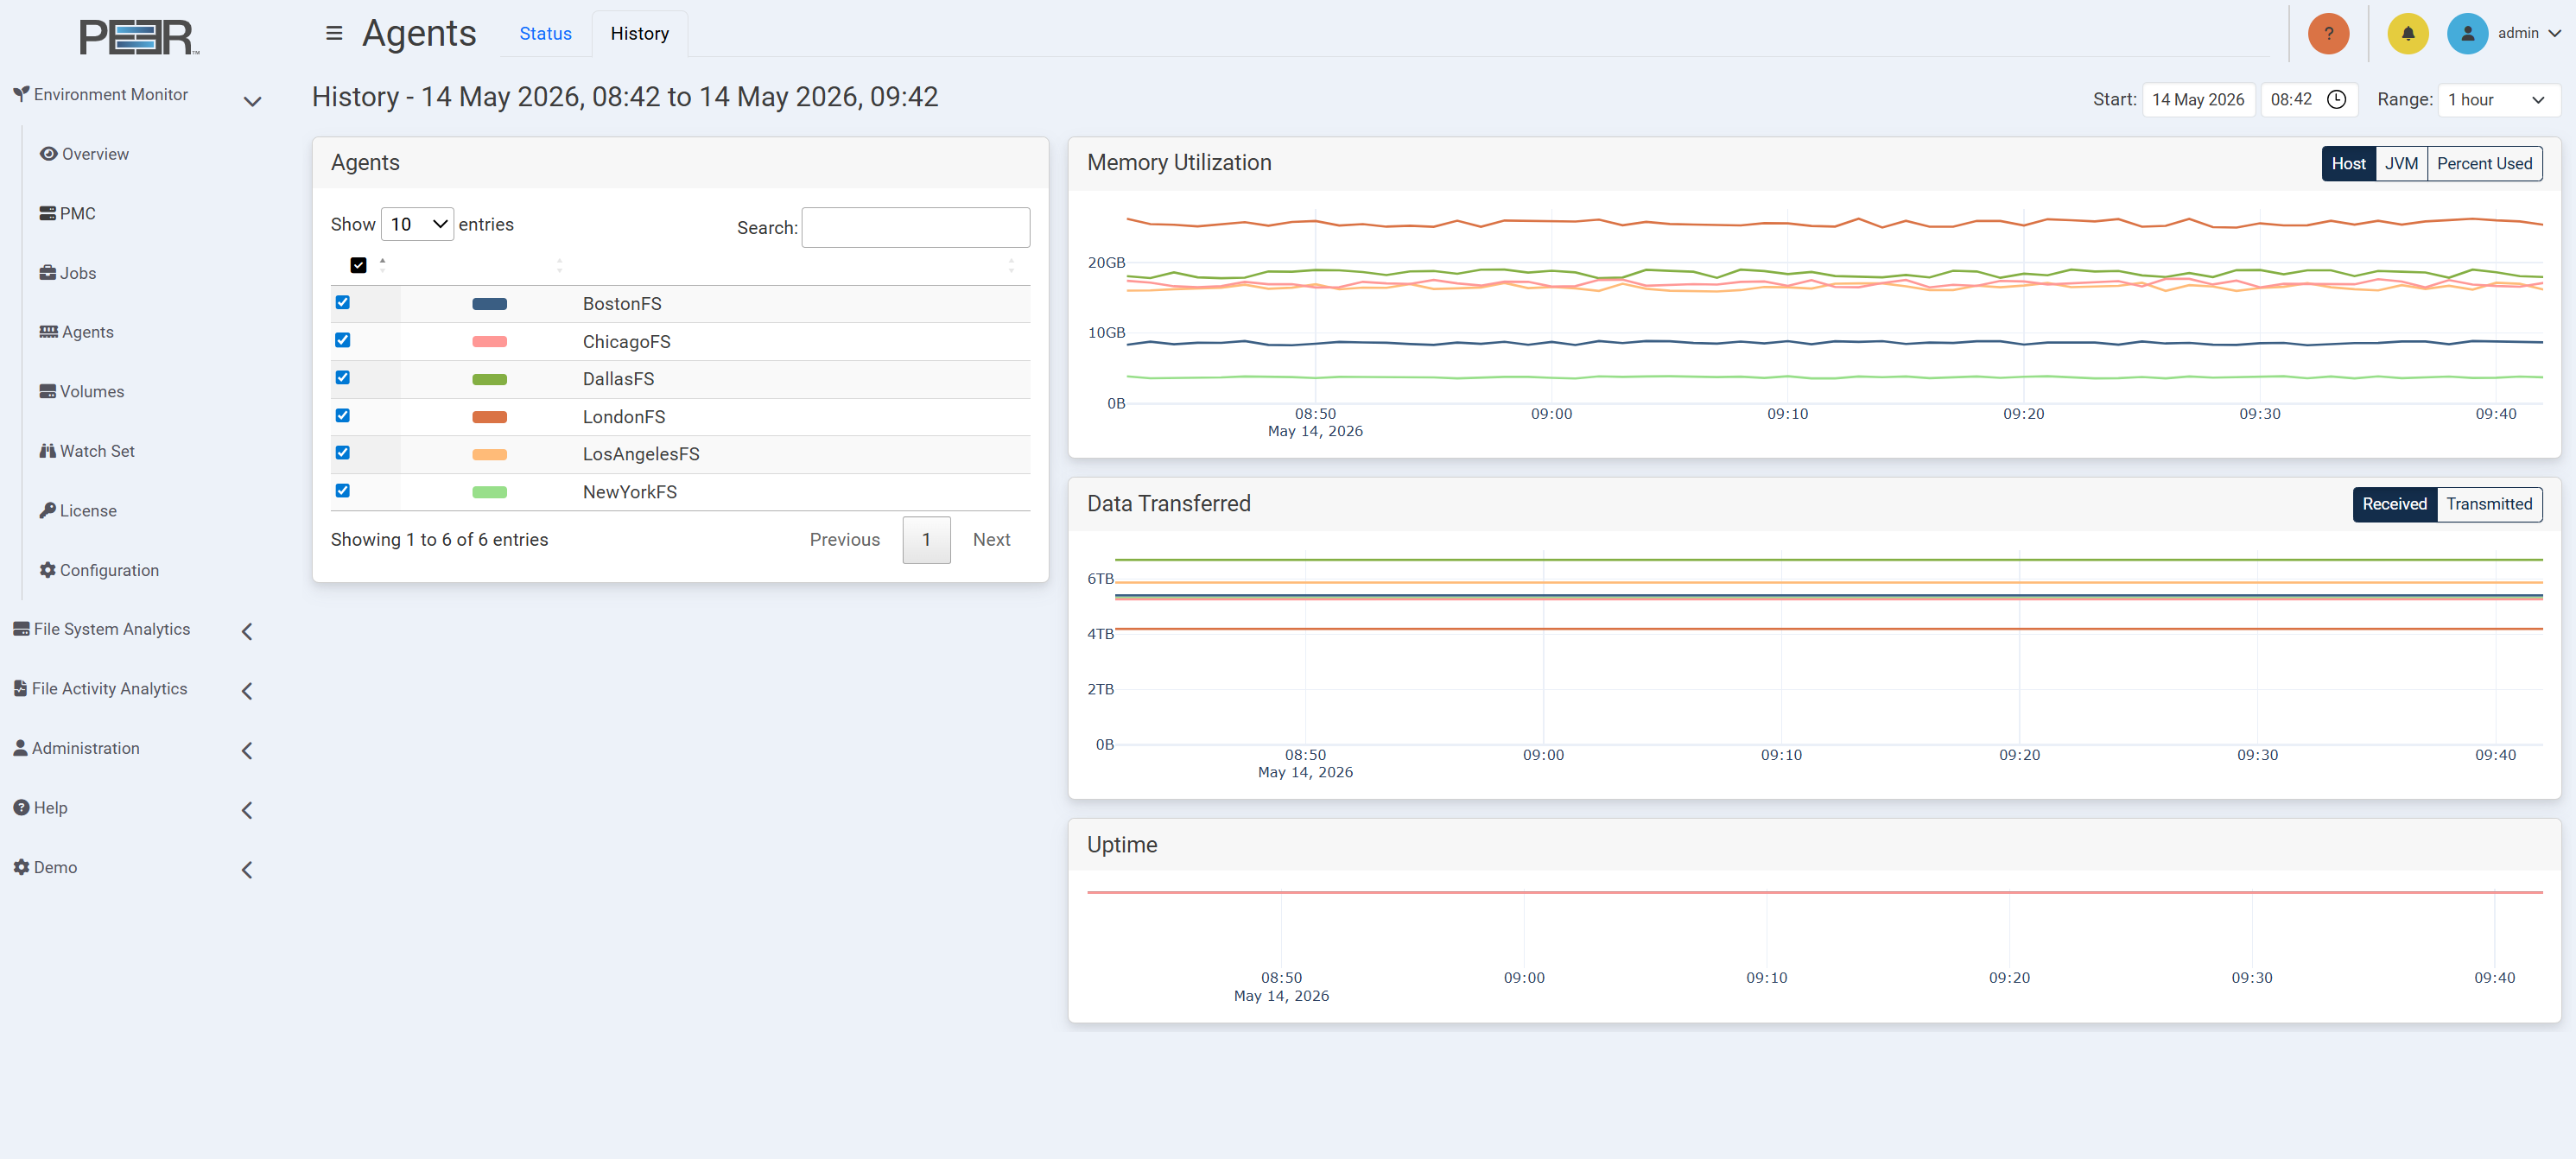
The History tab contains four cards.
Agents
Displays a table listing the Agents included in the history graphs. The table shows each selected Agent and the color used to identify that Agent in the graphs.
Toggle the checkbox in the first column to show or hide the graph line representing that Agent in all graphs on the page.
Use the Show entries control to choose how many Agents are displayed. Use Search to filter the table.
Memory Utilization
Displays a line graph that shows the memory utilization of the selected Agents over time. You can view:
- Host: Shows host memory usage for the selected Agents.
- JVM: Shows Java Virtual Machine memory usage for the selected Agents.
- Percent Used: Shows memory usage as a percentage.
Use the options in the upper right corner of the card to switch between the available views.
Data Transferred
Displays a line graph that shows the amount of data transferred for the selected Agents over time. You can view either:
- Received: Shows data received by the selected Agents.
- Transmitted: Shows data transmitted by the selected Agents.
Use the options in the upper right corner of the card to switch between the two transfer types.
Uptime
Displays a line graph that shows the uptime for the selected Agents over time.
Volumes Page
The Volumes page provides an overview of all the volumes that are being monitored by a PeerGFS job.
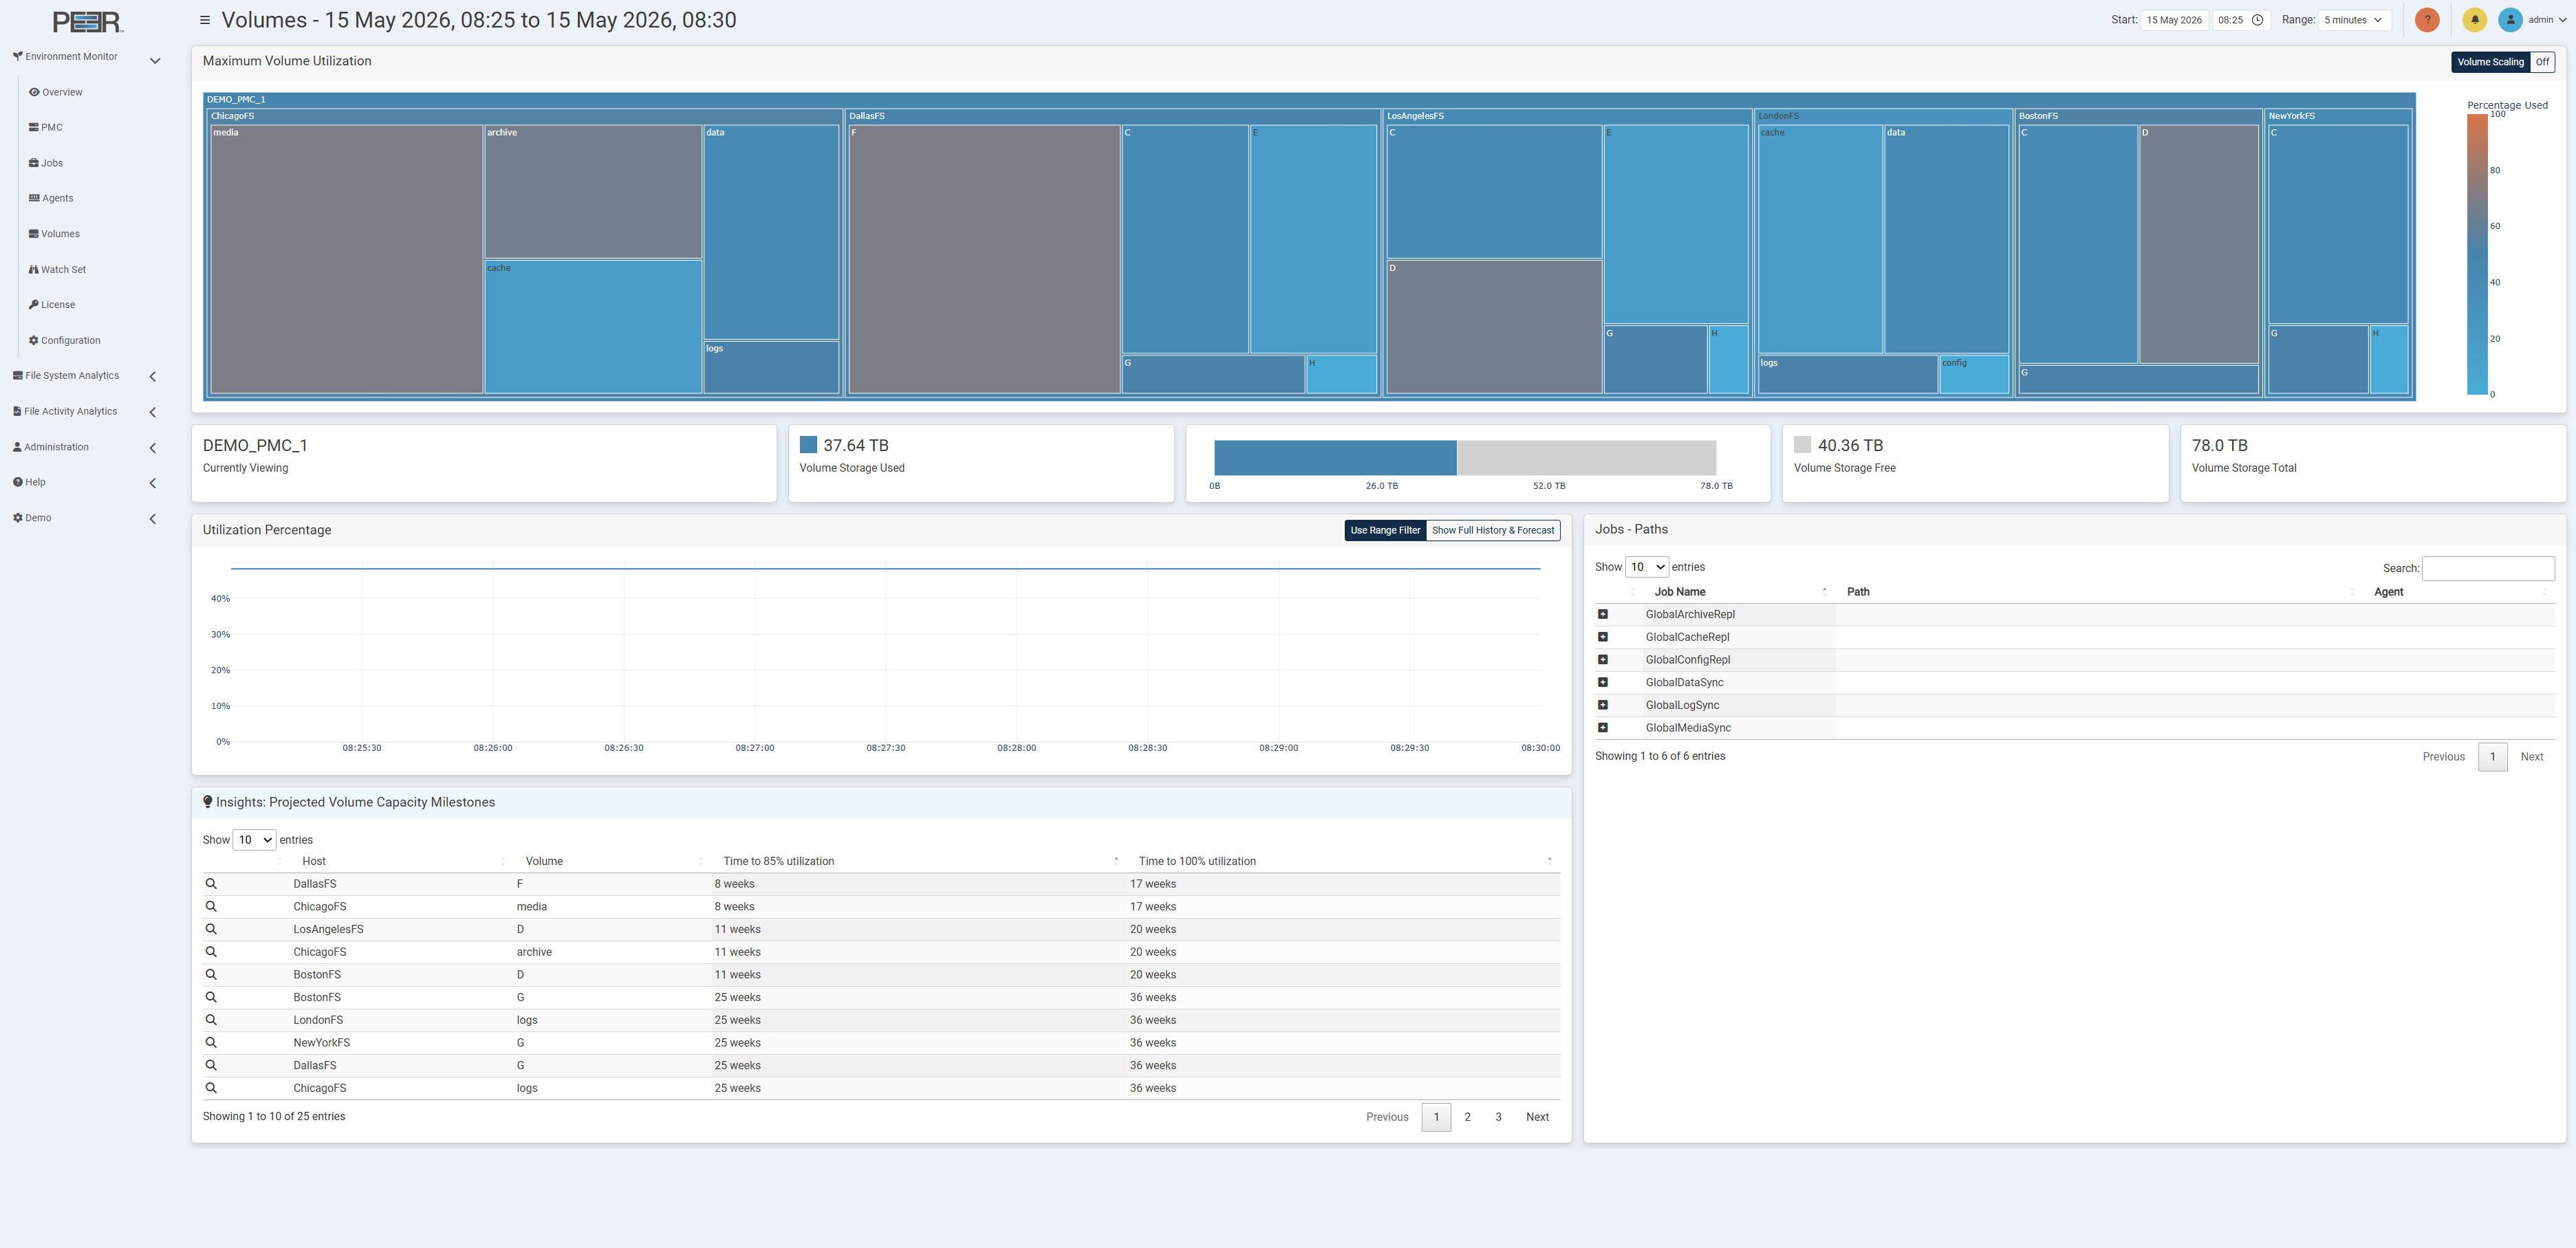
Volumes Page Cards
The Volumes page contains nine cards:
Maximum Volume Utilization
Displays a treemap of storage devices across the PeerGFS environment and their volumes. The treemap uses nested rectangles, arranged from largest in the top left to smallest in the bottom right, to represent storage volumes. Each nested rectangle represents a volume, with size proportional to the data it represents when the Volume Scaling option is set to On. Otherwise, each volume will be the same size.
The colors of the rectangles indicate the percentage of storage used, with the adjacent color scale identifying the percentage. Each storage device in the treemap has its own color.
- Click a nested rectangle to focus on that storage device or volume. The other cards will be updated to show data only for the selected item. Click again to return to the previous treemap view.
- Hover over an element within the treemap to display the total disk space and the percentage used for the current selection.
Currently Viewing
Displays the name of the selected storage device or volume.
Volume Storage Used
Displays the used storage for the selected storage device or volume.
Graph
Displays the used versus available storage for the selected storage device or volume.
Volume Storage Free
Displays the available storage for the selected volume.
Volume Storage Total
Displays the total storage for the selected volume.
Utilization Percentage
Displays a line graph of utilization over time for the selected volume.
Insights: Projected Volume Capacity Milestones
Displays projected storage capacity milestones for the monitored storage selection. The table identifies volumes that are predicted to reach key usage thresholds and shows the estimated time remaining until each threshold is reached.
The table displays the following information for each projected milestone:
- Host: The storage host where the volume is located.
- Volume: The volume being evaluated.
- Time to 85% utilization: The estimated time remaining before the volume reaches 85% utilization.
- Time to 100% utilization: The estimated time remaining before the volume reaches full utilization.
Click the magnifying glass icon for a row to focus the Volumes page on that host and volume. The treemap, summary cards, Utilization Percentage graph, and Jobs - Paths table update to show data for the selected item. When a row is selected, the Utilization Percentage graph switches to Show Full History & Forecast so that the historical utilization, predicted utilization, and 85% and 100% threshold markers are shown for the selected volume.
Use Show Full History & Forecast without selecting a row to view predicted utilization for the current storage selection.
Jobs - Paths
Displays a table of all PeerGFS jobs associated with the selected volume, with each row representing a job and the path to its watch set.
Expand the plus symbol to reveal the path and Agents linked to that volume. When expanded, the other two columns display the path to the watch set and Agent.
Watch Set Page
The Watch Set page provides an overview of all the watch sets in the environment.
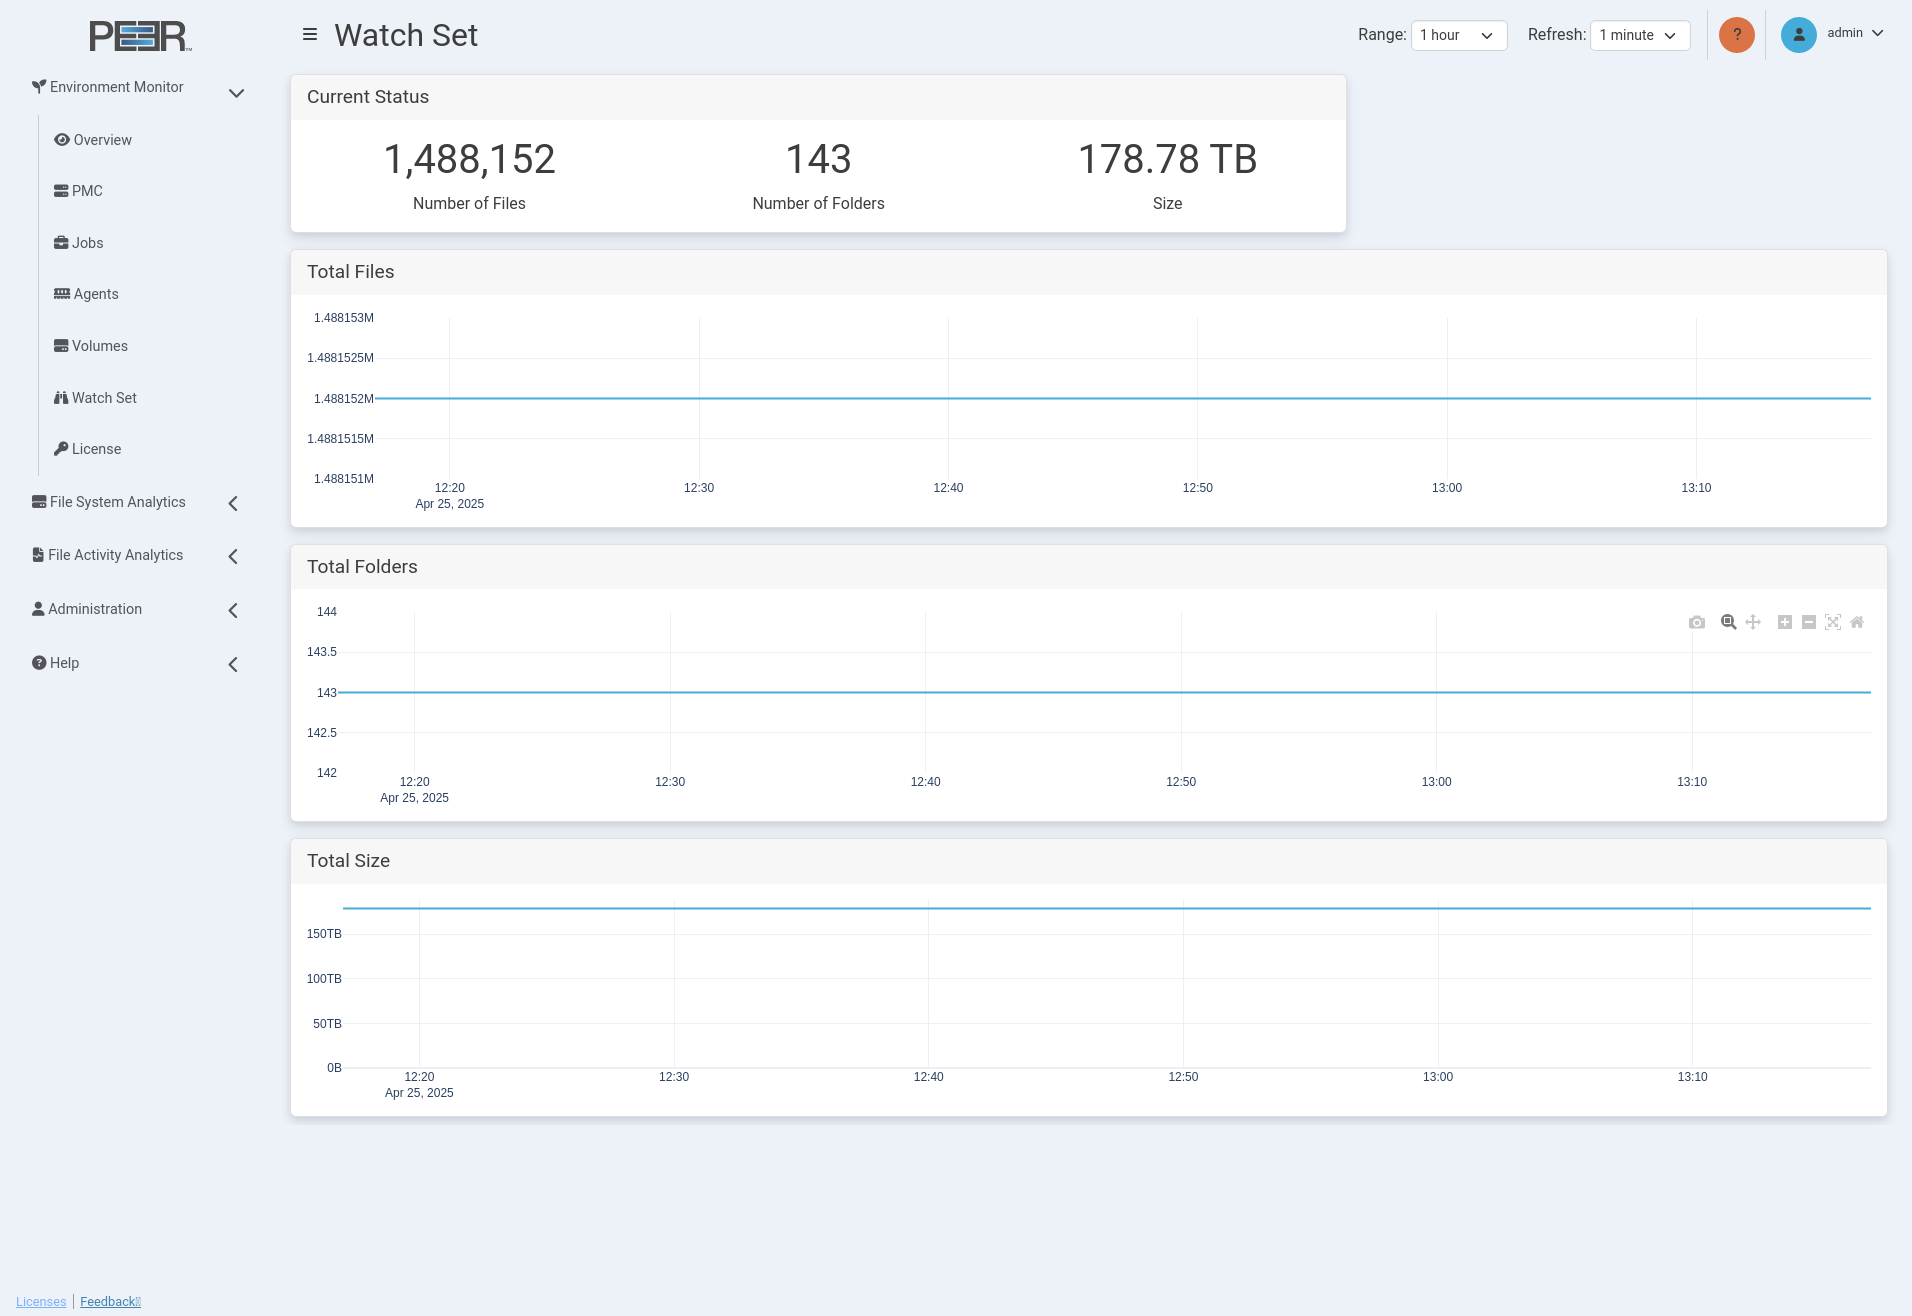
Watch Set Page Cards
The Watch Set page contains four cards:
Current Status
Displays:
- Number of Files: The total number of files in the environment’s watch sets.
- Number of Folders: The total number of folders in the environment’s watch sets.
- Size: The total size of all files in the environment’s watch sets.
Total Files
Displays a line graph that shows the total number of files in the watch sets.
Total Folders
Displays a line graph that shows the total number of folders in the watch sets.
Total Size
Displays a line graph that shows the total size of all files in the watch sets.
License Page
The License page provides an overview of the historical capacity usage of PeerGFS licenses, along with the capability to predict future license utilization. It is important to note that the accuracy of the prediction model improves with the availability of more historical data. To generate a reliable prediction, a minimum of one month of data is required, and the model can project license usage up to a maximum of one year into the future.
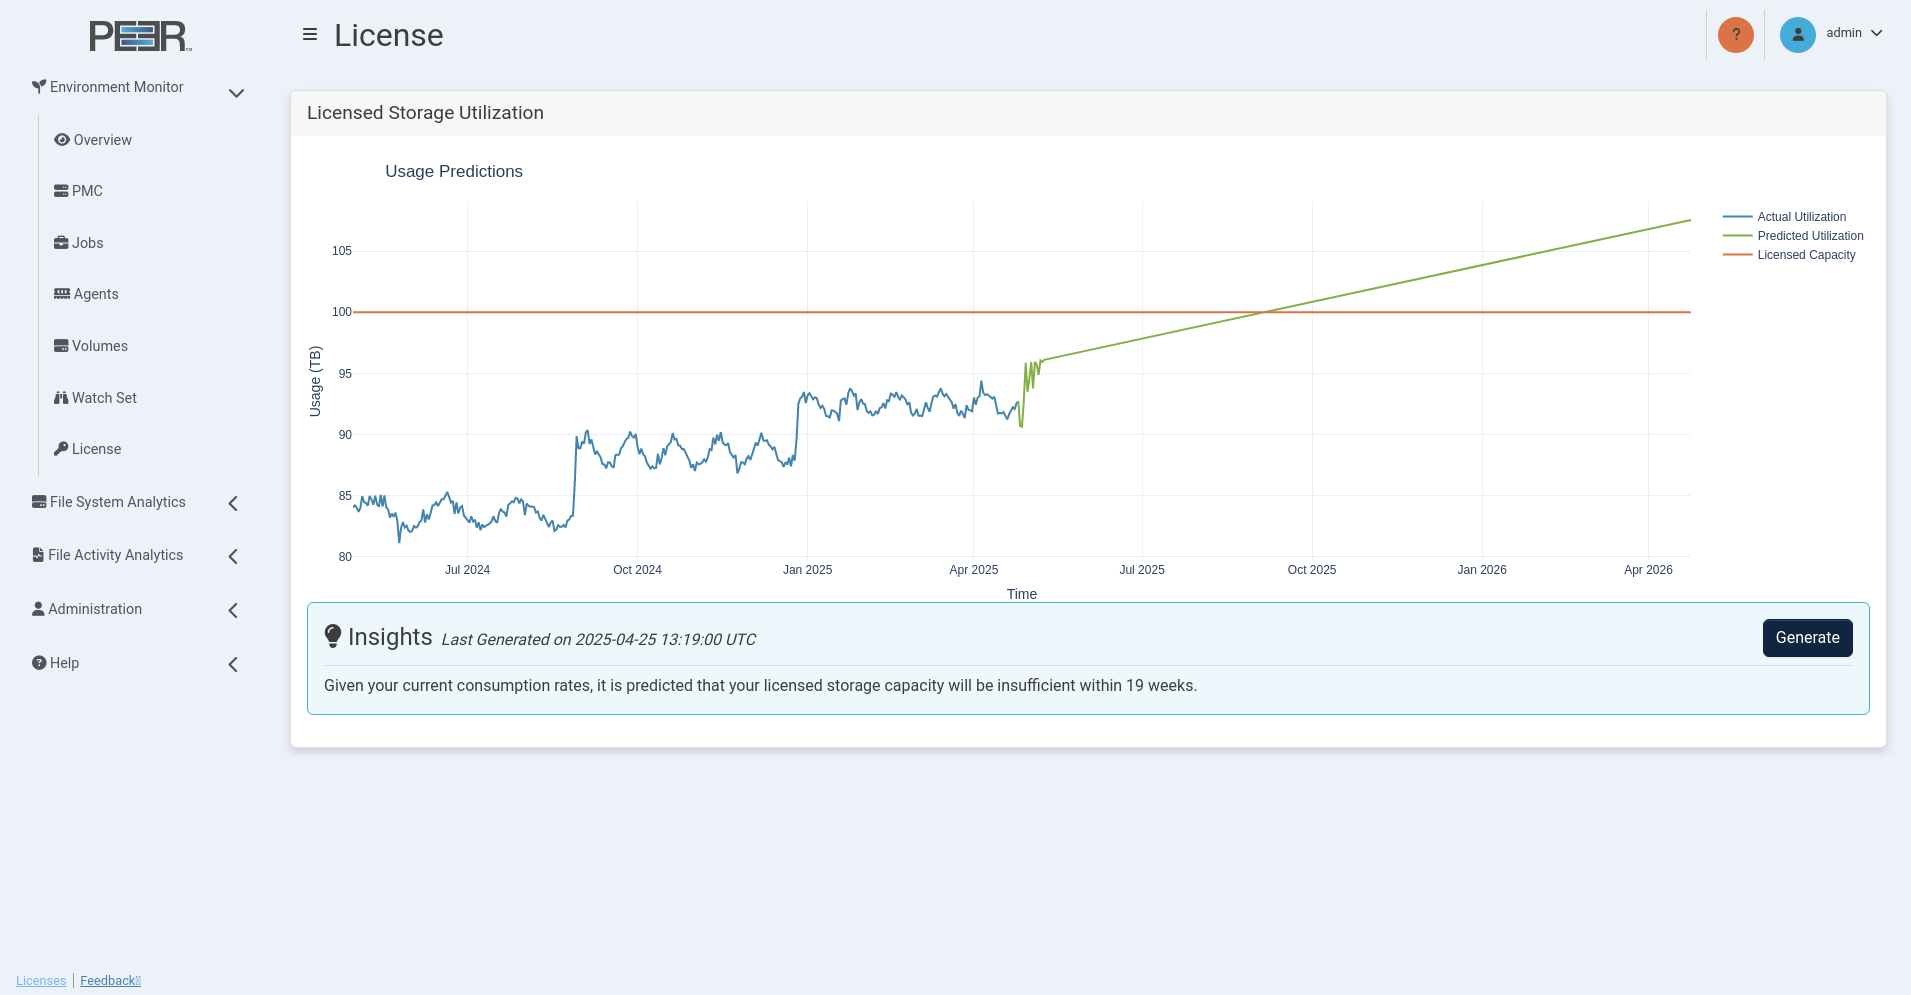
License Page Card
The License page contains one card:
Licensed Storage Utilization
Displays:
- Licensed Capacity: The amount of TB licensed for PeerGFS over time.
- Actual Utilization: The amount of TB used by PeerGFS over time.
- Predicted Utilization: The amount of TB predicted to be used by PeerGFS over time.
- Insights: Click the Generate button to generate insights into future license utilization. Once complete, the predicted utilization is updated on the graph.
You’ll also find an insight that indicates the remaining time until the licensed capacity is insufficient, based on the predicted utilization. We recommend considering additional license capacity from Peer Software to ensure uninterrupted usage of PeerGFS.
Environment Monitor Configuration
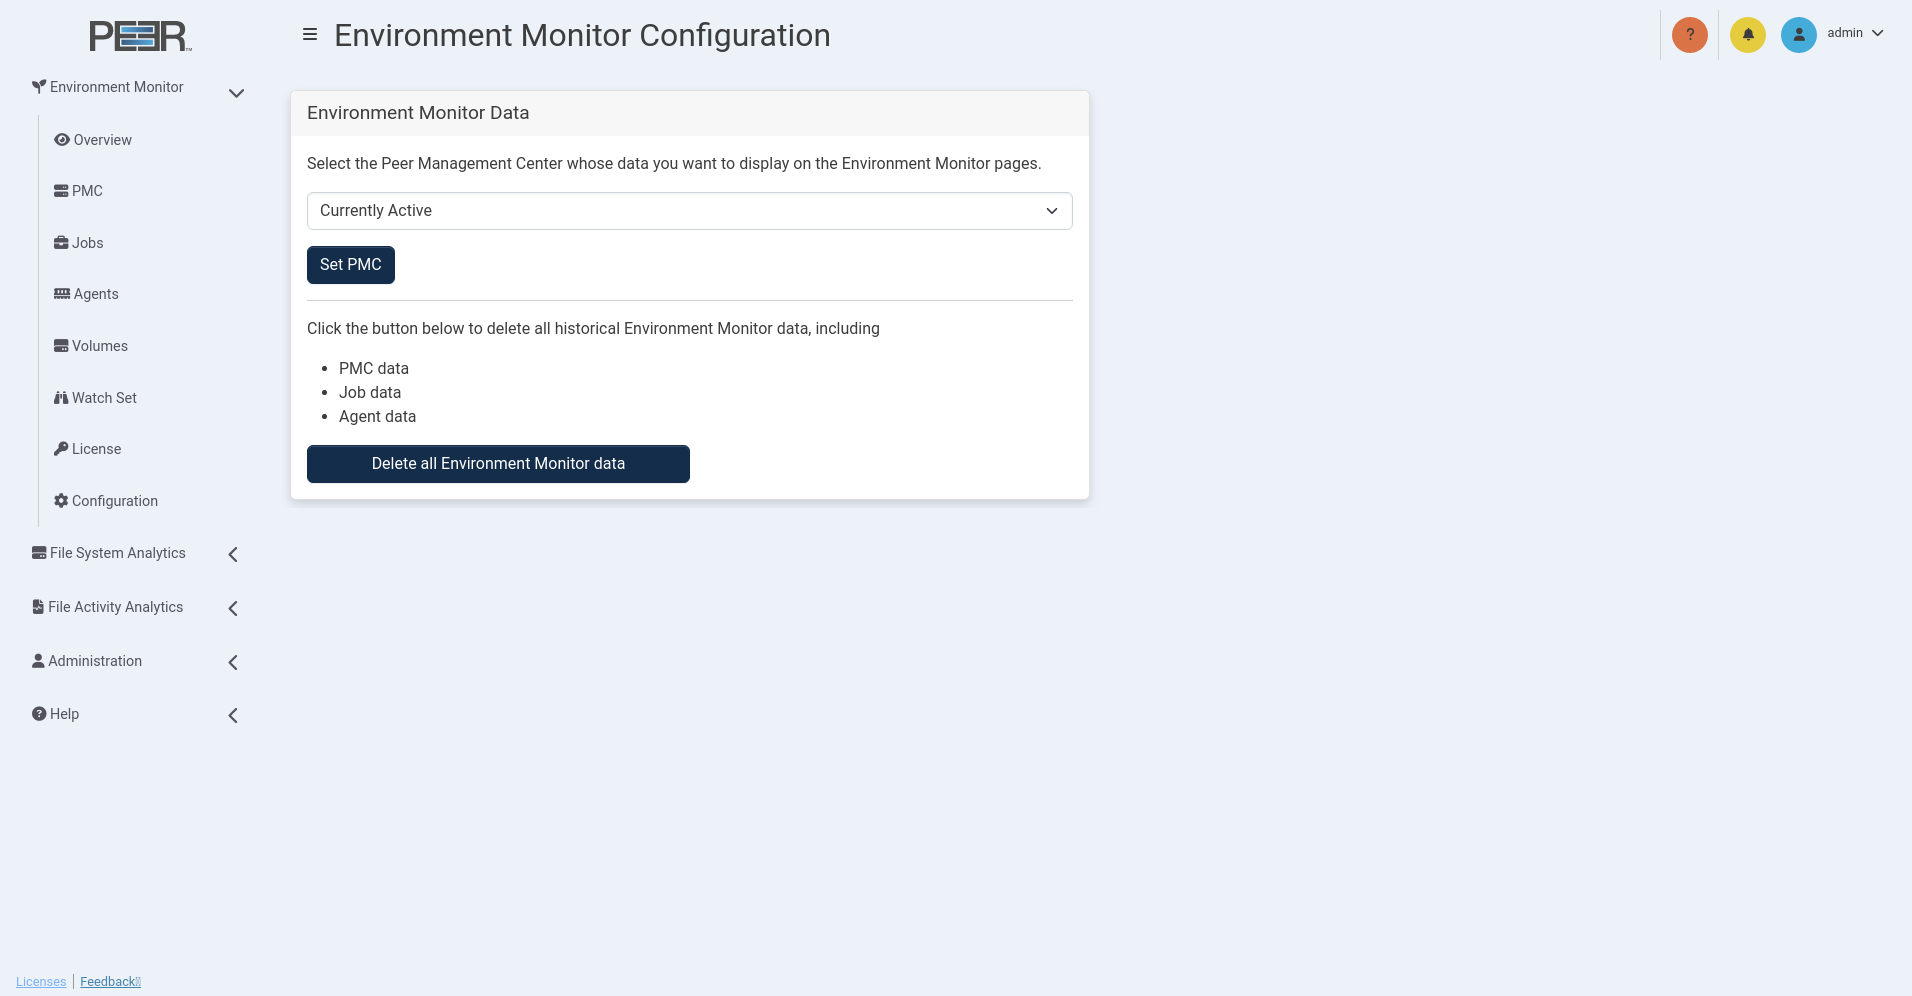
Managing Environment Monitor Data
To manage Environment Monitor data, use the following options on the Environment Monitor Data card:
-
Set PMC: Click this button to choose which PMC is used for the Environment Monitor pages. First, select a PMC or Currently Active from the dropdown menu. Currently Active will use the PMC that was most recently connected for the first time. Then, click Set PMC to apply your selection.
Note: This only applies to having a redundant PMC. PeerIQ cannot be connected to two separate PMCs.
-
Data retention policy: Use this dropdown menu to select how long Environment Monitor data is retained. The default retention period is 3 months. Data older than the selected retention period is deleted daily.
Available retention options include 1 month, 3 months, 6 months, and 12 months.
Note: Reducing the retention period permanently deletes Environment Monitor data older than the new limit. Increasing the retention period does not restore previously deleted data.
-
Delete all Environment Monitor data: Click this button to erase all Environment Monitor data, including PMC, Job, Agent, Volume and License data.