|
<< Click to Display Table of Contents >> Main View |
  
|
|
<< Click to Display Table of Contents >> Main View |
  
|
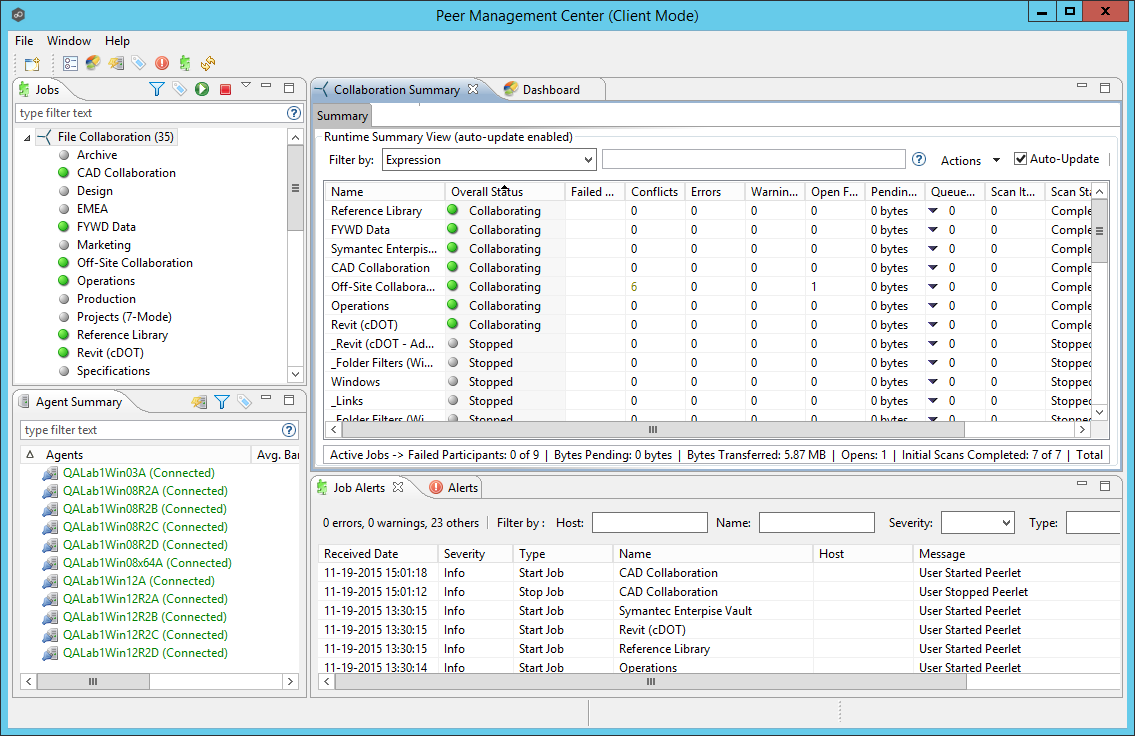
After starting up the Peer Management Center Client, the following Main View is displayed:

The Peer Management Center is made up of the following Views:
Jobs View |
The Jobs View is a list of all created file collaboration jobs that can be modified, viewed, and started. The list is grouped by Peerlet type, where the primary type is File Collaboration.
The following buttons are available within this panel: •Start and Stop buttons allow you to start and stop any selected jobs. •View Runtime Summary button displays a table of summary information for all jobs of a selected Peerlet type. |
Agent Summary View |
The Agent Summary View displays a list of known Peer Agents and connection status for each. Individual Peer Agents can be updated and restarted from this view as well by right-clicking on one or more items and selecting the appropriate item from the popup menu. |
Alerts View |
The Alerts View displays a list of Peer Management Center alerts that have occurred with detailed information about each alert. Alerts relating to Peer Agent connection status changes will be reported here. |
Job Alerts View |
The Job Alerts View displays a list of all job-specific alerts that have occurred (including those for file collaboration sessions) with detailed information about each alert. Alerts relating to the automatic stopping and restarting of jobs will be reported here. |
File Collaboration Runtime View (tabbed View in center of screen) |
The Peerlet Editors View is the default location of the Collaboration Summary View, in addition to runtime and configuration sub-views for all open jobs.
For each open file collaboration job, the following sub-views are available as tabs: •Summary Tab - Displays current synchronization summary and session statistics. •Session Tab - Shows currently opened files, session locks, and files being synchronized. •Event Log Tab - Displays a log of recent file activity. •File Conflicts Tab - Shows a list of current file conflicts and quarantined files. •Alerts Tabs - Displays alerts tied specifically to the selected job. •Participants Tab - List of currently configured and associated host participants for the selected job, in addition to connection status for each. •Configuration Tab - Shows a summary of all configurable items for the selected job. |
Dashboard |
Shows the Dashboard Summary View panel which displays metrics and key performance indicators from all running File Collaboration Jobs, File Synchronization Jobs, and Agents. |
Peer Agent Detail Summary |
The Peer Agent Detail Summary is a panel which displays a list of all known Peer Agents deployed and their detailed status information which can be used to assess the health of the environment. |
Table Detail Viewer
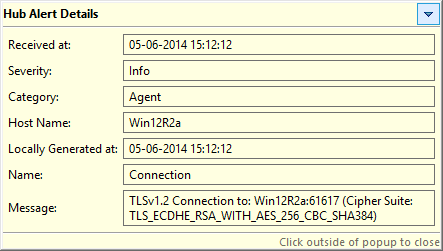
Most tables shown throughout the Peer Management Center support double-clicking on any row. This action will bring up a popup dialog containing all of the details pertaining to the information in that row. An example is shown below:

In addition, most right-click context menus contain the ability to copy this detailed information on one or more rows all at the same time. This information can then be pasted into any document editor.