|
<< Click to Display Table of Contents >> Synchronization Dashboard Summary View |
  
|
|
<< Click to Display Table of Contents >> Synchronization Dashboard Summary View |
  
|
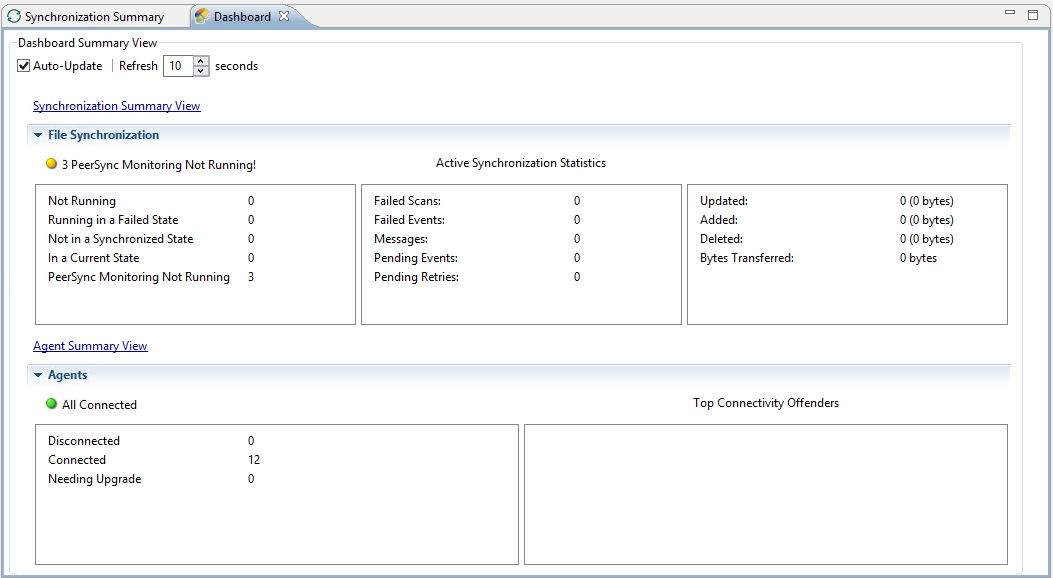
The File Synchronization Dashboard Summary View is a panel that displays metrics and key performance indicators from all running File Synchronization Jobs. It is automatically displayed when the Peer Management Center client is started and can be opened at any other time by selecting View Dashboard from the Windows menu or by clicking on the View Dashboard icon in the Peer Management Center toolbar.

The Dashboard is not updated in real-time. This is done for performance reasons. Instead, the table can be set to automatically update itself every few seconds. Enabling the Auto-Update option will enable this functionality, while the Refresh interval (in seconds) can be set right beside the checkbox.
Entries in the first column of the File Synchronization Job and Agents categories can be double-clicked, which will take the user to a filtered Runtime View of the selected item for additional details.