|
<< Click to Display Table of Contents >> Peer Agent Summary View |
  
|
|
<< Click to Display Table of Contents >> Peer Agent Summary View |
  
|
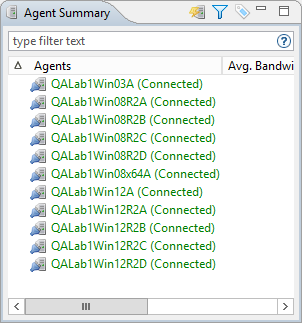
The Peer Agent Summary View is located in the bottom left section of the Peer Management Center below the Job View. This view contains a list of all known Peer Agents installed in your environment and displays the current connection status for each.

Toolbar
The following buttons are available on the toolbar within the Peer Agent Summary View:
View Agent Detail Summary |
Opens the Peer Agent Detail Summary View panel which provides details for all known Agents and their status. |
Manage, Save and Load Filters |
Allows for the selection of built-in or user-defined filters and to save / manage filter expressions. Default Agent filters include Connected and Disconnected. |
Assign Tags |
Opens the Assign Tags dialog where resources can be viewed and assigned to tags or categories. Tagging resources helps when managing large number of resources. |
Filtering
To filter through a large list of Agents, use the Filter field located below the toolbar buttons in the Peer Agent Summary View panel. For more details on how to filter through resources, see Filter Expressions.
Valid connection statuses are:
Connected |
Indicates Peer Agent is currently connected to the Peer Management Center Broker. |
Disconnected |
Indicates that Peer Agent has disconnected from the Peer Management Center Broker. This can be a result of stopping the Peer Agent, or if the network connection between the Peer Agent and the Peer Management Center Broker was severed. |
Pending Disconnect |
This indicates that a heartbeat for the Peer Agent was not received within the configured threshold and that the Peer Agent is in the process on being disconnected if a heartbeat is not received soon. This status can also occur if the Peer Agent does not respond to a pending ping. |
Unknown |
If no connection status is displayed, then either the Peer Agent was not running on that host when the Peer Management Center was started, or the first heartbeat message has not been received from that host. |
Peer Agent Menu Options
Right clicking on one or more host names in the Peer Agent list will open a context popup menu with the following options:
Remove |
This will remove the selected Peer Agent(s) from the view, but if the Peer Agent is still running or connects again, then it will be added back to the list when the next heartbeat is received. |
View Properties |
Displays properties for the selected Peer Agent, e.g. heartbeat information, host machine configuration, messaging statistics, performance statistics, etc. See the section View Peer Agent Properties Dialog for more details. |
Edit Configuration |
Clicking on this menu item will display a dialog where you can edit user configurable properties for the selected Peer Agent. |
Restart Agent Service |
If the selected Peer Agent is connected, this menu item will restart the Peer Agent Windows service running on the corresponding host. In the event that the Peer Agent is not connected to the Peer Management Center Broker, an attempt will be made to restart the Peer Agent Windows service using the Windows sc command. Please note that this will only work if the user running the Peer Management Center Client can access the remote Peer Agent system and has the appropriate domain permissions to start and stop services on the remote Peer Agent system. |
Remote Desktop |
Launch a Windows Remote Desktop connection to the selected Peer Agent. |
Edit Agent Configuration |
This action displays a dialog through which the selected Peer Agent can be configured. Configurable options include Peer Management Center Broker connectivity, Peer Agent logging, Peer Agent memory usage, among others. For more information, see the page on Central Peer Agent Configuration. |
Retrieve Log Files |
This action retrieves log files for the selected Peer Agent containing information used by our technical support staff to assist in debugging issues. The log files are encrypted and will be located in the support folder of the Peer Management Center installation directory. They can optionally be uploaded to our technical support team. |
Test Agent Bandwidth Speed |
If the selected Peer Agent is connected, this menu item will start a bandwidth speed test to be performed in the background. You will be notified at completion with the results of the test. |
Generate Thread Dump |
This will generate a thread dump for the selected Peer Agent which can be used by our technical support to debug certain issues. The debug file will be located in the Peer Agent installation directory. |
Generate Memory Dump |
This will generate a memory dump for the selected Peer Agent which can be used by our technical support to debug certain issues. The debug file will be located in the Peer Agent installation directory. |
Memory Garbage Collection |
Force a garbage collection operation to attempt to reclaim memory that is no longer used within the Peer Agent's JVM. |
Copy File |
This action copies a specified file from the Peer Management Center to the designated target folder on each selected Peer Agent. The target folder is relative to the Peer Agent installation directory. |
Transfer Rate Report (not available on Web Client) |
This action displays a time series performance chart of average transfer rate for the selected Peer Agent over the last 24 hours. |
Peer Agent Updates
Additionally, if the Peer Agent software running on a host is out of date, the host will be shown as having a pending update in the Peer Agent Summary View. When right-clicking on the host, the option to automatically update the Peer Agent software will also be available. This process can be done right from the Peer Management Center and usually does not require any additional actions on the host server itself.
View Peer Agent Properties Dialog
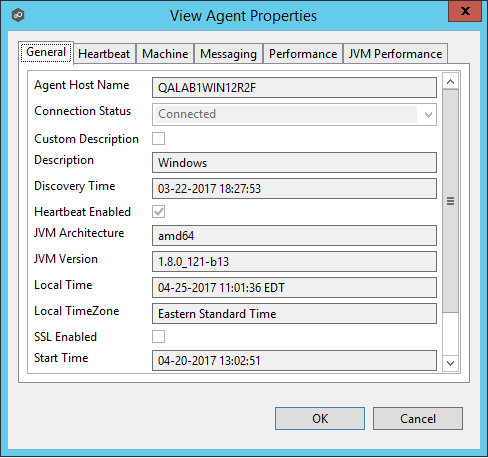
Selecting "View Agent Properties" menu item for a selected host will result in the opening of the following Peer Agent Properties dialog:

This dialog displays Peer Agent and host machine information across the following categories:
General |
Displays general Peer Agent runtime information such as, discovery time, local time, SSL use, Peer Agent startup time, Peer Agent version, user name Peer Agent service is running as, etc. |
Heartbeat |
Displays heartbeat information and statistics such as, heartbeat frequency, avg heartbeat time, last heartbeat time, total Peer Agent disconnects, total missing heartbeats, etc. |
Machine |
Displays machine information of the host that the Peer Agent is running on such as, # of processors, computer name, domain name, IP address, installed memory, O/S, etc. |
Messaging |
Displays general Peer Management Center Broker messaging statistics for the selected host, such as, total messages received, total messages sent, # errors, etc. |
Performance |
Displays general performance statistics for the underlying host machine such as, available virtual memory, available physical memory, memory load, etc. |
JVM Performance |
Displays JVM performance statistics for the running Peer Agent application such as active # of threads, heap memory used, non-heap memory used, etc. |
Edit Peer Agent Properties Dialog
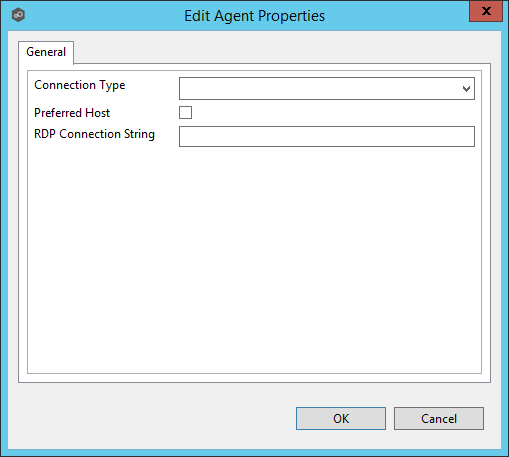
Selecting "Edit Agent Properties" menu item for a selected host will result in the opening of the following Peer Agent Properties dialog:

This dialog displays the following configurable Peer Agent and host machine options:
Connection Type |
Allows for the selection of a connection type between selected Peer Agent and it's associated Peer Management Center Broker. When set, optimizations are made to the communication between the two parties based on the selected connection type. |
Preferred Host |
A best practice optimization for selecting which Peer Agent has the fastest connection to the Peer Management Center Broker (or in appropriate cases, for selecting which Peer Agent are on the same subnet as the Peer Management Center Broker) |
RDP Connection String |
The connection string to use when activating an RDP session to this Peer Agent. |