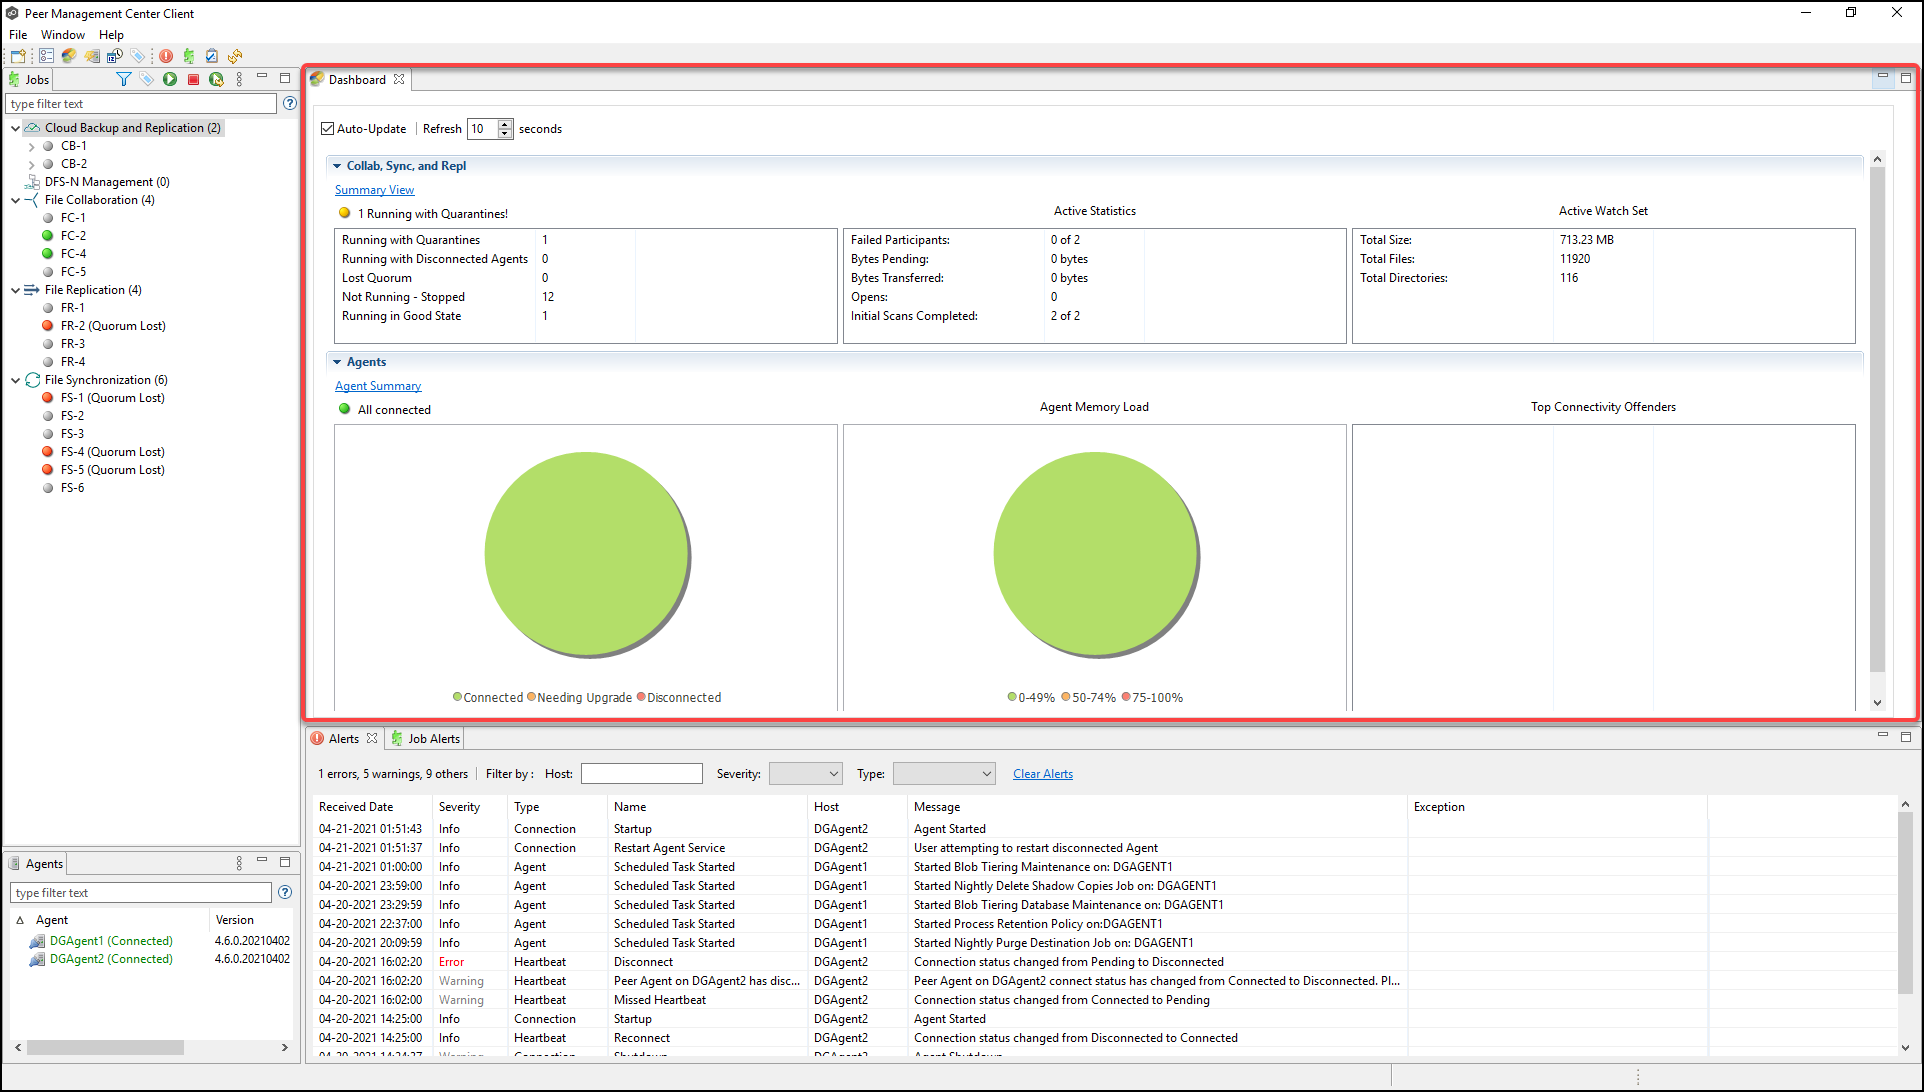
The Dashboard is divided into two sections:
•Collab, Sync, and Repl - This top section displays a table of metrics and key performance indicators for all running File Collaboration, File Synchronization, and File Replication jobs. It also contains a link that opens the Collab, Sync, and Repl Summary view. Entries in the table's first column can be double-clicked to display a filtered runtime view of the selected item for additional details.
•Agents - The bottom section displays information about Agents. It also contains a link that opens the Agent Summary view.
Click the triangle to the left of the section name to collapse and expand the section.
For performance reasons, the Dashboard is not updated in real-time. However, you can set the table to be automatically updated every few seconds by selecting the Auto-Update checkbox, and then choosing the update interval.
To display the Dashboard, use one of the following methods:
•Select Show Dashboard from the Window menu.
•Click the Show Dashboard icon in the main Peer Management Center toolbar.
•Set the Dashboard to launch automatically at start. See General Configuration.