This step is optional.
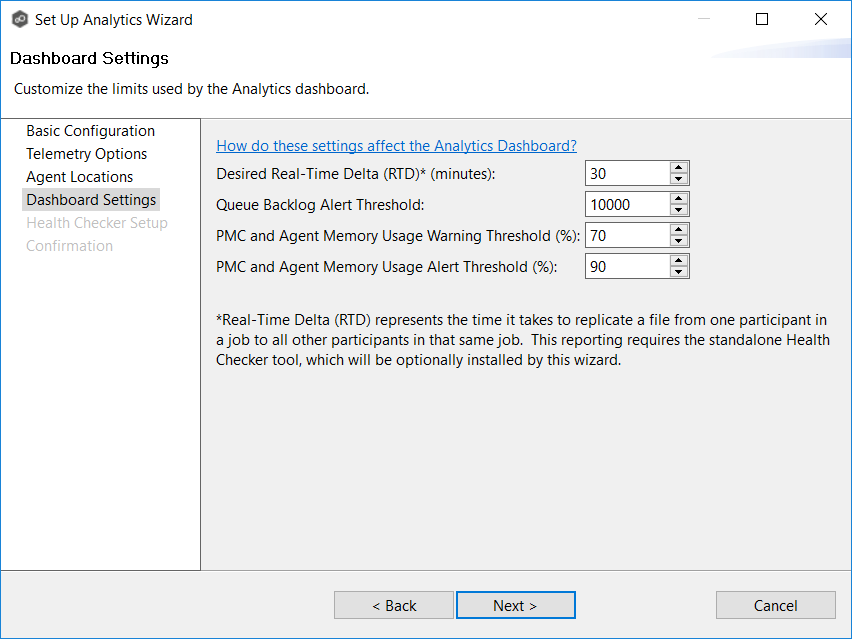
The Dashboard Settings page allows you to customize the desired real-time delta value and other dashboard settings.
1.Customize the Analytics Dashboard settings:
Setting |
Description |
|---|---|
Desired Real-Time Delta (RTD)* (minutes) |
Enter the maximum amount of time that is acceptable for a file change to replicate from one participant in a job to all other participants in that same job. Anytime a job is found to be taking more than the desired RTD, the Analytics Dashboard will display warnings. The default is 30 minutes. The minimum is 5; the maximum is 1440. Note: This only applies to real-time activity. It does not apply to scans or bulk activity. |
Queue Backlog Alert Threshold |
Enter the desired threshold for alerts about queue backlog. Once the queues inside PeerGFS hit this threshold, the Analytics Dashboard will display warnings. The default is 10000 items in the queue before an alert is sent. The minimum is 1000; the maximum is 1000000. |
PMC and Agent Memory Usage Warning Threshold (%) |
Enter the desired threshold for warnings about both Agent and PMC service memory usage. If either the PMC or any Agent hits this threshold, the Analytics Dashboard will display warnings. The default is 70 percent of memory usage. The minimum is 50 percent; the maximum is 95 percent. |
PMC and Agent Memory Usage Alert Threshold (%) |
Enter the desired threshold for alerts about both Agent and PMC service memory usage. If either the PMC or any Agent hits this threshold, the Analytics Dashboard will display errors. The default is 90 percent of memory usage. The minimum is 75 percent; the maximum is 100 percent. |
2.Click Next.
The Health Checker Setup page appears.