The Analytics Preferences page allows you to enable and disable the Analytics engine and modify Analytics settings. If you disable Analytics, you will need to rerun the Set Up Analytics wizard, which you can access by selecting Analytics from the Help menu.
For information about setting up Analytics, see Setting Up Analytics in Advanced Topics.
To modify Analytics settings:
1.Select Preferences from the Window menu.
2.Select Analytics in the navigation tree.
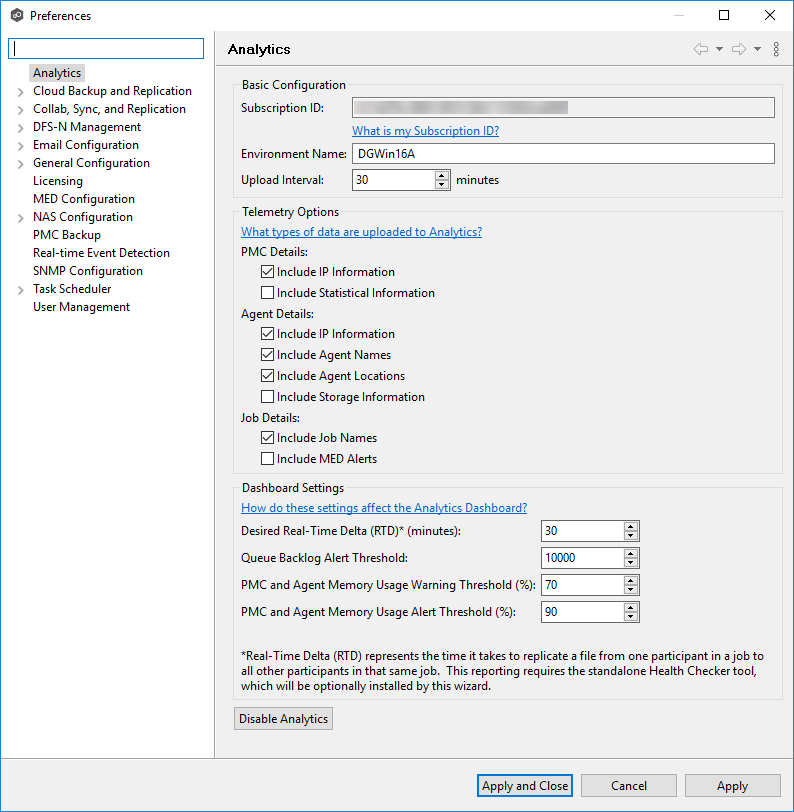
3.Select options in the Basic Configuration section.
Setting |
Description |
|---|---|
Subscription ID |
Enter your subscription ID if the field is not auto-filled. Contact Peer Software if you do not know your Subscription ID. Once you enter a value, it cannot be changed. |
Environment Name |
In the Environment Name field, change the name if the auto-filled value doesn't match the name of the environment where the PMC server is installed. Note: Changing the name here will change the name in the General Configuration page in Preferences. |
Upload Interval |
In the Upload Interval field, enter the number of minutes to wait between uploads of data to the Analytics Dashboard. The default upload interval is 30 minutes. The minimum interval is 15 minutes; the maximum interval is 180 minutes |
4.Select options in the Telemetry Options section.
Category |
Standard Data Upload |
Include Options |
|---|---|---|
PMC Details |
Includes details about this PMC deployment. Details include service memory consumption, replication backlog, quarantines, license consumption, and watch set size. |
•IP Information - The IP address of the server that this PMC is installed on. •Statistical information - In-depth statistics about the queues and performance of PeerGFS's replication engine. |
Agent Details |
Includes the details about the Agents that are connected to this PMC. Details include service and server memory consumption, replication throughput, uptime, operating system, and disconnect counts. |
•IP information - The IP addresses of the servers that the Agents are installed on. •Agent Names - The names assigned to the Agents (typically the name of each Agent's Windows Server). If this option is not checked, random strings will be used in the Analytics Dashboard to represent each Agent. •Agent Locations - The locations (the latitude, longitude, city, state, and country) of the Agents. This information is entered either through the Set Up Analytics wizard or in the Agent Configuration dialog. Agent locations can be displayed in a map showing replication traffic by geographic location. •Storage Information - Information specific to the storage platforms that each Agent is managing, including available and used disk space. |
Job Details |
Includes the details about the file collaboration, synchronization and/or replication jobs configured within this PMC. Per-job details include replication backlog, replication throughput, scan details, and watch set growth. |
•Job Names - The names of the file collaboration, synchronization, and replication jobs configured in this PMC. If this option is not checked, random strings will be used in the Analytics Dashboard to represent each job. •MED Alerts - If MED alerts are enabled in this PMC, this option will include any alerts for use in the Analytics Dashboard. |
5.Select options in the Dashboard Settings section.
Setting |
Description |
|---|---|
Desired Real-Time Delta (RTD)* (minutes) |
Enter the maximum amount of time that is acceptable for a file change to replicate from one participant in a job to all other participants in that same job. Anytime a job is found to be taking more than the desired RTD, the Analytics Dashboard will display warnings. The default is 30 minutes. The minimum is 5; the maximum is 1440. Note: This only applies to real-time activity. It does not apply to scans or bulk activity. |
Queue Backlog Alert Threshold |
Enter the desired threshold for alerts about queue backlog. Once the queues inside the PMC hit this threshold, the Analytics Dashboard will display warnings. The default is 10000 items in the queue before an alert is sent. The minimum is 1000; the maximum is 1000000. |
PMC and Agent Memory Usage Warning Threshold (%) |
Enter the desired threshold for warnings about both Agent and PMC service memory usage. If either the PMC or any Agent hits this threshold, the Analytics Dashboard will display warnings. The default is 70 percent of memory usage. The minimum is 50 percent; the maximum is 95 percent. |
PMC and Agent Memory Usage Alert Threshold (%) |
Enter the desired threshold for alerts about both Agent and PMC service memory usage. If either the PMC or any Agent hits this threshold, the Analytics Dashboard will display errors. The default is 90 percent of memory usage. The minimum is 75 percent; the maximum is 100 percent. |
6.Click Apply and Close or Apply.