Alerts View |
  
|
Alerts View |
|
The Alerts View is automatically displayed when a critical system (Error or Fatal) alert is received. By default, the Alerts View is displayed under the File Collaboration Runtime View. You can close the view at anytime by clicking on the X (close) button on the Alerts tab. You can open the Alerts view at any time by clicking on the View Alerts button located on the PeerLink Hub toolbar or by selecting the Window menu, then the Show View submenu, followed by the View Alerts menu item.
Alert severity is broken down into four main categories: Informational (containing Info, Debug, and Trace), Warning, Error and Fatal. An example of an Informational alert is when an Agent connects to the PeerLink Broker. If an Agent's network connection is severed, then an Error alert will be logged. All alerts are also logged to the file hub_alert.log, available under the 'Hub\logs' subdirectory within the PeerLink Hub installation directory.
You can filter alerts based on host name, severity level, or type, and you can sort alerts by clicking on a specific column header. You can also clear all alerts in the table by clicking the Clear Alerts link.
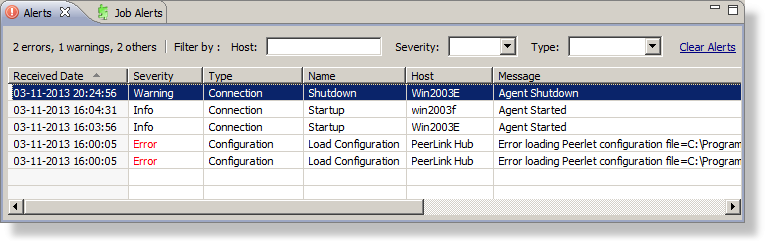
You can also resize the Alerts View by dragging the separator between the upper view and the Alerts View, or you can double-click on the Alerts tab to maximum the view. You can restore the view to it's original, non-maximized size by double-clicking on the Alerts tab again.